
Are you a Quiet Speculation member?
If not, now is a perfect time to join up! Our powerful tools, breaking-news analysis, and exclusive Discord channel will make sure you stay up to date and ahead of the curve.
Welcome back, readers!
The goal of this article is to review the annual reports that Hasbro and WoTC puts out and isolate relevant information that could have an impact on MTG finance. Unfortunately, WoTC is a small part of the Hasbro empire, so financial information on WoTC is typically buried deep in the Hasbro annual reports, which you can find here.
Hasbro bought WoTC September 30, 1999, so the annual reports are likely only going to contain Magic data starting in 2010. I will post the data I've found by year below (along with any additional sources) and then we'll delve into the data (I will highlight playerbase related data in green and financial data in red).
But first,
Why Bother to Analyze Annual Reports?
This is a valid question. Like all businesses, you can learn a lot by following the money (and the playerbase growth).
If we assume that Magic: the Gathering print runs are correlated with the playerbase and sales (it seems a smart business like Hasbro/WoTC would do this), then we can also get an idea of which print runs might be smaller (as it makes no sense for a business to print the same number of cards when sales of said cards are down then when sales are up). We aren't likely to come up with a quantitative data set, but we can at least get an idea of likely trends.
Now for the good stuff.
1993 - 2000
- No relevant data
2001
- WoTC sales up 23%.
- 5,000,000 players
2002
- TCG sales declined 8% (includes Magic: the Gathering, but mainly Pokemon).
2003
- 6,000,000+ players
- 140,000 MTGO Accounts
- Game segments revenue up 40% (includes MTG, but also includes board games, etc.)
2004
- 6,000,000+ players
- Game segments had a decline in sales of 1%.
- Magic had a decline in sales overall.
- International MTG sales increased.
2005
- Game segments had a new revenue decline of 8%.
- Magic had a decline in revnue (both in the US and internationally).
2006
- Magic had a decline in sales overall.
2007
- No relevant data
2008
- Magic had a decline in revenue.
- Revenues under 100 million.
2009
- US and Canada sales revenues for Magic were up.
- International sales revenues for Magic were down.
2010
- US and Canada sales for Magic were up.
- International sales revenues for Magic were up.
2011
- Doubled in size since 2008.
- Increased US and Canada sales.
- Increased international sales.
2012
WoTC Annual Report states:
- 500,000 registered players
- 6,000,000 unregistered players
- 30,000,000 inactive players
Hasbro Annual Report states:
- Magic grew 30%.
- 4th straight year of 25% or more growth.
- Increase in net revenues for US and Canada.
- Increase in net revenues internationally.
2013
- Increased net revenues for US and Canada.
- Increased net revenues internationally.
2014
- 6th straight year of revenue growth.
- Product development has increased 5.2% (of which Magic accounted for at least some of this expense).
- Increase in selling, distributive, and administrative expenses primarily due to MTG.
- Increased net revenues for US and Canada.
- Increased net revenues internationally.
2015
- Annual report not released.
Looking at the Financial Side of Things
Below is a bar graph showing the years MTG had positive growth and the years it had negative growth. (Note the years are abbreviated to just the tens digit, so 1 is 2001, and so on.)
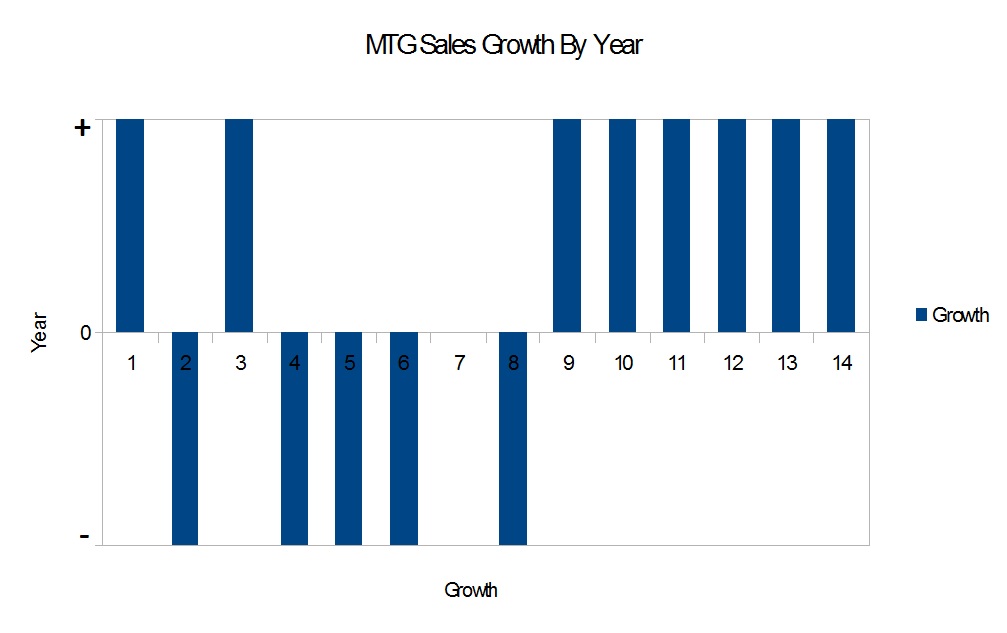
Looking at this growth chart we can now isolate the good years from the bad and more importantly we can determine which sets came out on good years vs. bad years.
If our original assumption is correct, then there are likely fewer cards from bad years than good years (as players didn't buy as much product.) So a card from a bad year that shows sudden demand might hold more potential as a spec. At the same time it's also important to keep in mind that the playerbase growth also likely affects the print run size.
| Year | Set 1 | Set 2 | Set 3 | Set 4 |
| 2001 | Planeshift | 7th Edition | Apocalypse | Odyssey |
| 2002 | Torment | Judgement | Onslaught | |
| 2003 | Legions | Scourge | 8th Edition | Mirrodin |
| 2004 | Darksteel | Fifth Dawn | Champions of Kamigawa | |
| 2005 | Betrayers of Kamigawa | Saviors of Kamigawa | 9th Edition | Ravnica: City of Guilds |
| 2006 | Guildpact | Dissension | Time Spiral | |
| 2007 | Planar Chaos | Future Sight | Tenth Edition | Lorwyn |
| 2008 | Morningtide | Shadowmoor | Eventide | Shards of Alara |
| 2009 | Conflux | Alara Reborn | Magic 2010 | Zendikar |
| 2010 | Worldwake | Rise of the Eldrazi | Magic 2011 | Scars of Mirrodin |
| 2011 | Mirrodin Besieged | New Phyrexia | Magic 2012 | Innistrad |
| 2012 | Dark Ascension | Avacyn Restored | Magic 2013 | Return to Ravnica |
| 2013 | Gatecrash | Dragon's Maze | Magic 2014 | Theros |
| 2014 | Born of the Gods | Journey into Nyx | Magic 2015 | Khans of Tarkir |
The bad years are highlighted in red above. It's important to note that both 2002 and 2004 were bad years, but they also only had three sets releases (which may be a contributing factor). It's not surprising to see 2004 was bad though, given the fact that Mirrodin block, and specifically the affinity mechanic, pushed a lot of players away from the game.
2005 followed it up with a much weaker Kamigawa block (to tone down Standard) which didn't seem to go over so well with the playerbase. What is surprising was that 2006 with the Ravnica block (which is often hailed by many players as one of the funnest blocks in Magic's history) was still a down year for the game, though this could be due to the fact that the Kamigawa block was weak enough that it didn't stop hurting the game until after it rotated out (this also would explain why 2007 was a good year).
Again for 2008, it's not surprising it was a bad year, as the Faerie menace was running amok in Standard--I remember a lot of local players talking about boycotting Standard until it rotated out.
As you can see from the chart, since 2008 Magic has had all positive revenue growth, which is a great sign.
Playerbase Growth
Unfortunately, we get a lot less information when it comes to the Magic playerbase from Hasbro or WoTC. What we do have is a meager chart that looks like this (note for 2012, I added the registered and active player numbers listed on the annual report):
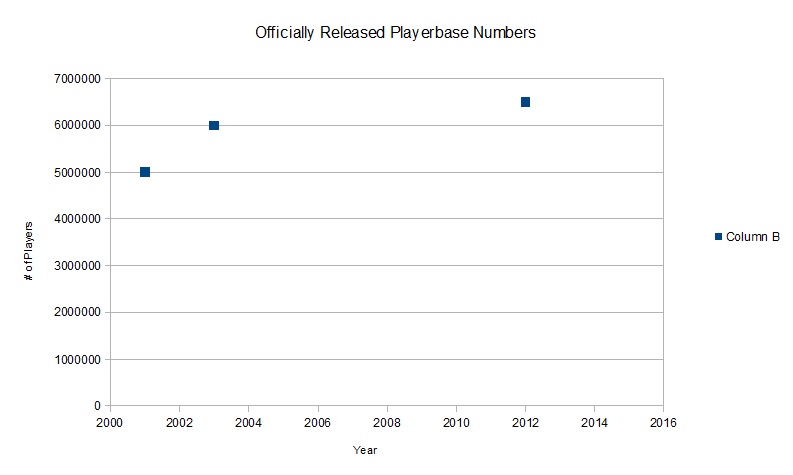
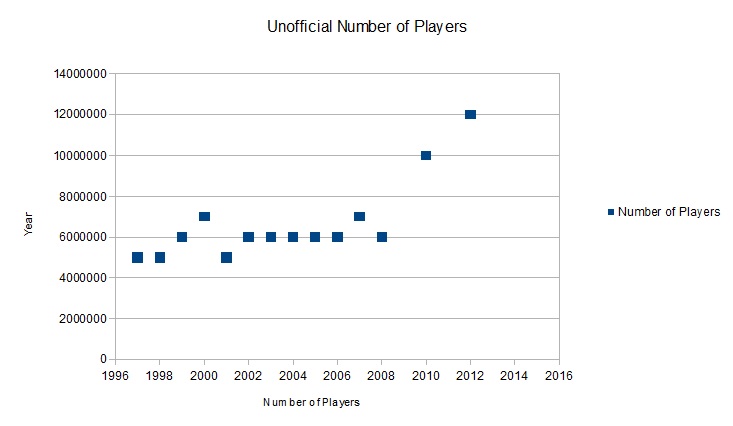
However, from other sources we get additional numbers to help fill in the gaps. Note the difference in the numbers for 2012.
From these charts we get a slightly different picture compared to our sales chart. Going by playerbase alone it would appear that 2001 and 2008 were bad years and everything in between was either positive or stayed the same.
What we can pull from the playerbase growth chart is that if the unofficial one is accurate than rares before 2010 are likely at least twice as rare as ones post-2012. This implies that any demand increases from these years will likely cause a higher price increase than the same demand from a post-2012 set.
Mythics are another interesting factor to consider. They didn't appear before 2008 (specifically Shards of Alara), but given the playerbase started to really explode post-2008, the fact that mythics were eight times rarer than regular rares would imply they're much rarer than even post-2008 rares. While the playerbase doubled in size, the rarity of these specific cards octupled. However, that is still based on our earlier assumption that the playerbase size directly impacts the print run size set by WoTC.
Because of the turning point in 2008 (when we saw both mythics appear and a rapid expansion of the playerbase), looking at the early mythics for financial opportunities doesn't seem like a bad idea.
Below is a list of those mythics, with the single-print ones in bold. Many of them already sit at a decent price, but there are some which are still decently cheap.
| Mythics | ||||
Shards of Alara |
Conflux |
Alara Reborn |
Magic 2010 |
Zendikar |
| Ajani Vengeant | Apocalypse Hydra | Defiler of Souls | Ajani Goldmane | Chandra Ablaze |
| Elspeth, Knight-Errant | Child of Alara | Dragon Broodmother | Baneslayer Angel | Eldrazi Monument |
| Empyrial Archangel | Conflux | Jenara, Asura of War | Bogardan Hellkite | Eternity Vessel |
| Godsire | Ethersworn Adjucator | Karrthus, Tyrant of Jund | Chandra Nalaar | Felidar Sovereign |
| Hellkite Overlord | Maelstrom Archangel | Lord of Extinction | Darksteel Colossus | Iona, Shield of Emeria |
| Kresh the Bloodbraided | Malfegor | Maelstrom Nexus | Garruk Wildspeaker | Kalitas, Bloodchief of Ghet |
| Lich's Mirror | Mirror-Sigil Sergeant | Sen Triplets | Jace Beleren | Lorthos, the Tidemaker |
| Mayael the Anima | Nicol Bolas, Planeswalker | Sphinx of the Steel Wind | Liliana Vess | Lotus Cobra |
| Prince of Thralls | Progenitus | Thraximundar | Master of the Wild Hunt | Mindbreak Trap |
| Rafiq of the Many | Thornling | Uril, the Miststalker | Platinum Angel | Nissa Revane |
| Sarkhan Vol | Protean Hydra | Ob Nixilis, the Fallen | ||
| Sedris, the Traitor King | Sphinx Ambassador | Obsidian Fireheart | ||
| Sharuum the Hegemon | Time Warp | Rampaging Baloths | ||
| Sphinx Sovereign | Vampire Nocturnus | Sorin Markov | ||
| Tezzeret the Seeker | Xathrid Demon | Warren Instigator | ||

Hi David,
some thoughts as I read this. I don’t have all the answers to these either.
– I would expect that because Wizards prints ahead of time a badly selling set may sometimes lead to reduced printing for the next set.
– 1993-2000: there are the print run numbers posted on Crystal Keep that are actually very relevant. Some actually take these and try to extrapolate.
– Possibly the bar chart could give an indication of how positive a year was? ’09 for example looks worse than ’10 going by the summary above.
– The last set in a year was usually released in September and it was always a big set. Through limited play I would imagine these sets have a big impact on the next year (they may be grouped with the wrong year).
– Core sets were never popular, but, having an extra set might still lead to increased sales in ’02 and ’04. My annecdotal impression was that Apocalypse, Odyssey and Onslaught did really well during their time, while the other sets in that timeframe were a bit lackluster. Possibly in ’02 Onslaught didn’t do well enough to compensate for Torment and Judgment? Similarly perhaps in ’05 Ravnica was not enough to compensate for Kamigawa block?
– MaRo has stated that Time Spiral block was bad for sales as the casual players didn’t seem to be buying the sets (though competitive players were), I’m therefore surprised by ’07.
– When the Mythic rarity was announced there was an article looking at the actual rarity of the cards. An old rare came out similar to a Mythic in the new structure. In a way Rares became a rarity between the old Uncommon and Rare. It works out this way because they print fewer cards per set and while you get 1 Mythic per 8 packs there are fewer Mythics, so you are more likely to get a particular one. I believe a reference to that article would have been very good for your article and I think it may be worthwhile to revisit some of what you’re saying as Mythics aren’t quite as rare as you assume.
I appreciate the feedback. I’ll try to address your points as best as I can.
1. That’s a very valid point, however, given how LONG a set is in rotation it’s unlikely they print ALL the cards before the sets release and then just divy up the print run…it’s more likely they print X # of cards before release and then print more “as needed”. If that’s the case then poorly selling sets WOULD still have a lower overall print run.
2. I’ve previously alluded to that very data (and attempted to extrapolate it myself), however, this article’s focus was on the data explicitly given in the annual reports; thus while always interesting and useful it would be a bit off subject.
3. That would also have made for a good graphic and if/when I do another similar article I’ll look at incorporating more information into my graphics.
4. That’s a very valid point, however, the annual reports are broken down by years and not by set releases; but what I still find odd is that even Ravnica’s release led into a bad year (sales wise).
5. It’s perfectly logical to assume that years with 4 set releases would be more profitable then ones with 3 sets (even if the 3 sets were slightly more desirable), simply because enough of the playerbase will buy/draft/etc the new sets out of habit.
6. I’d love a link to MaRo’s statement (not that I don’t believe you), but Hasbro’s own annual reports specifically in regards to MTG had positive sales growth in ’07.
7. I actually agree with your statement 100%, which is why my focus on the mythics was relegated to the first few sets with them (as the playerbase grows, the print run likely follows, and there would in fact be a lot more mythics in the market). However, prior to the rapid playerbase growth the mythics would still be 8x rarer than a rare from the same set and with relative stagnant playerbase growth leading up to 2008, the first few sets of mythics are far more likely to truly be closer to 8x rarer than a rare from those earlier pre-mythic sets.