
Are you a Quiet Speculation member?
If not, now is a perfect time to join up! Our powerful tools, breaking-news analysis, and exclusive Discord channel will make sure you stay up to date and ahead of the curve.
Welcome back, readers! This week's article will focus on the concept of cost justification.
This is something we do subconsciously all the time. Buying cereal at the grocery store, for example, you pick the lowest-cost option that you or your family will enjoy. You can't justify buying a more expensive box when there are plenty of acceptable options that taste the same, or similar enough.
We apply this concept when evaluating Magic cards as well. When evaluating a card's power level, we compare it to other cards with the same converted mana cost. This is why Tarmogoyf is so much better than Grizzly Bears. Both cost 1G, but Tarmogoyf is usually a much bigger threat than a 2/2.
Business Decisions
These examples are fine ways to explain the concept. What I want to discuss today is how cost justification can be used to make decisions about business expenses.
One of the principle tools associated with cost justification is the cost-benefit analysis. Wikipedia has a really good definition of Cost Benefit Analysis (CBA).
"In CBA, benefits and costs are expressed in monetary terms, and are adjusted for the time value of money, so that all flows of benefits and flows of project costs over time (which tend to occur at different points in time) are expressed on a common basis in terms of their 'net present value'."
Stores need to consider this when setting buylist prices, though admittedly a card's future value is often amorphous and difficult to conceive. This much is obvious.
But what about store upgrades? It seems obvious that if you have a small store and your current playerbase takes up most of your playing room, you'll want to grow your store space to accommodate future growth. But how much room do you need to add?
I've found the easiest way to explain things is via examples, so here it is.
Bill and Janet own a card store. They currently have about 20 players every FNM and enough table space to accommodate 24 players.
They've tracked their in-store sales over the past few months (which covered a new set release) and calculated that each player spends $60 a month on average. Their current rent is $700 a month. Utilities are $100. Taxes are $75.
They are considering moving to the following stores:
- Store A - Holds 36 players. Rent $1000/Utilities $125
- Store B - Holds 40 players. Rent $1200/Utilities $130
- Store C - Holds 46 players. Rent $1400/Utilities $145
We can break this data down into a table for easier processing:
| Measurements | Option 1 (No Change) |
Option 2 (Store A) |
Option 3 (Store B) |
Option 4 (Store C) |
| Increased Revenue | 0 | 720 | 960 | 1320 |
| Larger Tournament Capability (reduced cost of sealed product) | 0 | 100 | 150 | 175 |
| Capital Investment (additional chairs/tables) | 0 | -507 | -696 | -1014 |
| Cost of Moving | 0 | -300 | -300 | -300 |
| Rent | -700 | -1000 | -1200 | -1400 |
| Utilities | -100 | -125 | -130 | -145 |
| Taxes | -75 | -75 | -75 | -75 |
| Total After First Month (including one-time expenses) | -875 | -1187 | -1291 | -1439 |
| Total After Second Month | -875 | -380 | -295 | -125 |
The table shows about what we'd expect. The first month (with one-time expenses included) would imply that no move is better than any move. However, once one-time costs are removed from the equation, the largest store becomes the best option.
Incorporating Growth Rate
Unfortunately, the table makes one big assumption that could be very costly in the long run. It assumes the store would suddenly have the maximum number of players it can support.
This is highly unlikely, unless a competing store goes out of business the same month of the move. A considerably slower playerbase growth is far more likely.
It would be much smarter and safer to graph the CBA with an estimated playerbase growth rate. Obviously, this rate is hard to pin down, so it might be wise to vary the growth rate and see how long it takes each option to break even.
Below is the table for a 3% playerbase growth.
| Week # | Playerbase | No Change Profit/Debt | Store A Profit/Debt | Store B Profit/Debt | Store C Profit/Debt | Playerbase Growth Rate |
| 1 | 20.0 | $325.00 | -$807.00 | -$1,201.00 | -$1,734.00 | 3.0% |
| 2 | 20.6 | $650.00 | -$768.00 | -$1,365.50 | -$2,112.75 | |
| 3 | 21.2 | $975.00 | -$691.92 | -$1,492.92 | -$2,454.42 | |
| 4 | 21.9 | $1,300.00 | -$577.65 | -$1,582.15 | -$2,757.90 | |
| 5 | 22.5 | $1,625.00 | -$424.04 | -$1,632.04 | -$3,022.04 | |
| 6 | 23.2 | $1,950.00 | -$229.91 | -$1,641.41 | -$3,245.66 | |
| 7 | 23.9 | $2,275.00 | $5.95 | -$1,609.05 | -$3,427.55 | |
| 8 | 24.6 | $2,600.00 | $284.80 | -$1,533.70 | -$3,566.45 | |
| 9 | 25.3 | $2,925.00 | $607.93 | -$1,414.07 | -$3,661.07 | |
| 10 | 26.1 | $3,250.00 | $976.66 | -$1,248.84 | -$3,710.09 | |
| 11 | 26.9 | $3,575.00 | $1,392.35 | -$1,036.65 | -$3,712.15 | |
| 12 | 27.7 | $3,900.00 | $1,856.44 | -$776.06 | -$3,665.81 | |
| 13 | 28.5 | $4,225.00 | $2,370.35 | -$465.65 | -$3,569.65 | |
| 14 | 29.4 | $4,550.00 | $2,935.59 | -$103.91 | -$3,422.16 | |
| 15 | 30.3 | $4,875.00 | $3,553.70 | $310.70 | -$3,221.80 | |
| 16 | 31.2 | $5,200.00 | $4,226.26 | $779.76 | -$2,966.99 | |
| 17 | 32.1 | $5,525.00 | $4,898.82 | $1,304.91 | -$2,656.09 | |
| 18 | 33.1 | $5,850.00 | $5,571.38 | $1,887.82 | -$2,287.43 | |
| 19 | 34.0 | $6,175.00 | $6,243.94 | $2,530.24 | -$1,859.26 | |
| 20 | 35.1 | $6,500.00 | $6,916.50 | $3,233.95 | -$1,369.80 | |
| 21 | 36.1 | $6,825.00 | $7,589.06 | $3,937.66 | -$817.22 | |
| 22 | 37.2 | $7,150.00 | $8,261.62 | $4,641.36 | -$199.61 | |
| 23 | 38.3 | $7,475.00 | $8,934.18 | $5,345.07 | $484.96 | |
| 24 | 39.5 | $7,800.00 | $9,606.74 | $6,048.78 | $1,238.51 | |
| 25 | 40.7 | $8,125.00 | $10,279.31 | $6,752.49 | $2,063.12 | |
| 26 | 41.9 | $8,450.00 | $10,951.87 | $7,456.19 | $2,960.90 | |
| 27 | 43.1 | $8,775.00 | $11,624.43 | $8,159.90 | $3,858.68 | |
| 28 | 44.4 | $9,100.00 | $12,296.99 | $8,863.61 | $4,756.47 | |
| 29 | 45.8 | $9,425.00 | $12,969.55 | $9,567.31 | $5,654.25 | |
| 30 | 47.1 | $9,750.00 | $13,642.11 | $10,271.02 | $6,552.03 | |
| 31 | 48.5 | $10,075.00 | $14,314.67 | $10,974.73 | $7,449.82 | |
| 32 | 50.0 | $10,400.00 | $14,987.23 | $11,678.44 | $8,347.60 | |
| 33 | 51.5 | $10,725.00 | $15,659.79 | $12,382.14 | $9,245.39 | |
| 34 | 53.0 | $11,050.00 | $16,332.35 | $13,085.85 | $10,143.17 | |
| 35 | 54.6 | $11,375.00 | $17,004.91 | $13,789.56 | $11,040.95 | |
| 36 | 56.3 | $11,700.00 | $17,677.48 | $14,493.27 | $11,938.74 | |
| 37 | 58.0 | $12,025.00 | $18,350.04 | $15,196.97 | $12,836.52 | |
| 38 | 59.7 | $12,350.00 | $19,022.60 | $15,900.68 | $13,734.30 | |
| 39 | 61.5 | $12,675.00 | $19,695.16 | $16,604.39 | $14,632.09 | |
| 40 | 63.3 | $13,000.00 | $20,367.72 | $17,308.09 | $15,529.87 | |
| 41 | 65.2 | $13,325.00 | $21,040.28 | $18,011.80 | $16,427.65 | |
| 42 | 67.2 | $13,650.00 | $21,712.84 | $18,715.51 | $17,325.44 | |
| 43 | 69.2 | $13,975.00 | $22,385.40 | $19,419.22 | $18,223.22 | |
| 44 | 71.3 | $14,300.00 | $23,057.96 | $20,122.92 | $19,121.00 | |
| 45 | 73.4 | $14,625.00 | $23,730.52 | $20,826.63 | $20,018.79 | |
| 46 | 75.6 | $14,950.00 | $24,403.08 | $21,530.34 | $20,916.57 | |
| 47 | 77.9 | $15,275.00 | $25,075.65 | $22,234.05 | $21,814.35 | |
| 48 | 80.2 | $15,600.00 | $25,748.21 | $22,937.75 | $22,712.14 | |
| 49 | 82.6 | $15,925.00 | $26,420.77 | $23,641.46 | $23,609.92 | |
| 50 | 85.1 | $16,250.00 | $27,093.33 | $24,345.17 | $24,507.71 | |
| 51 | 87.7 | $16,575.00 | $27,765.89 | $25,048.87 | $25,405.49 | |
| 52 | 90.3 | $16,900.00 | $28,438.45 | $25,752.58 | $26,303.27 |
Below are graphical comparisons between a 2%, 3%, and 4% playerbase growth rate.
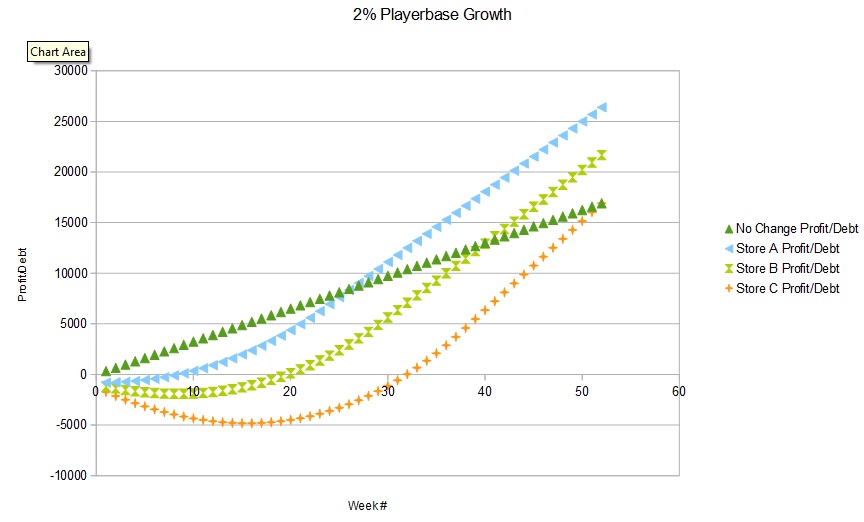
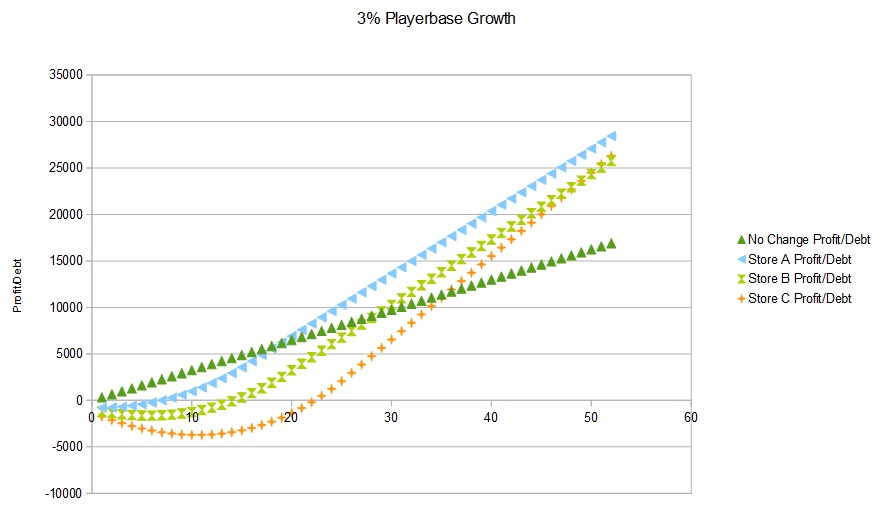
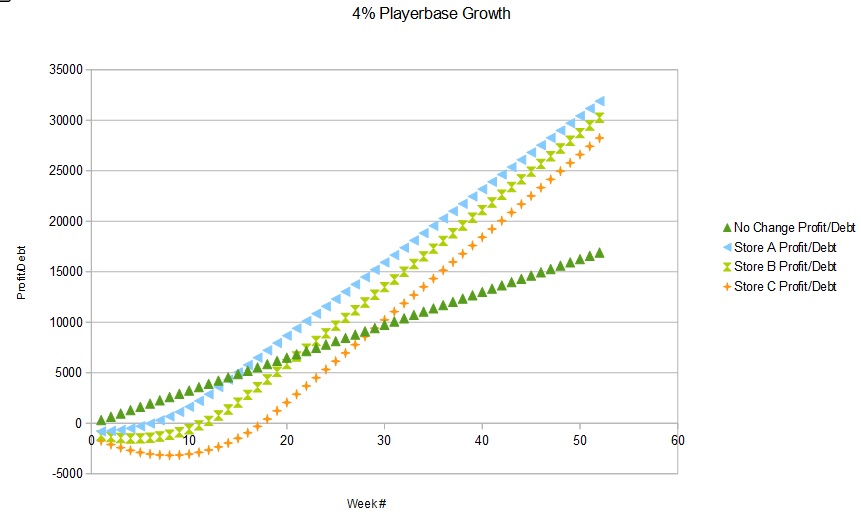
We can conclude from these graphs that, surprisingly, store A is actually the best option at these small (but reasonable) growth rates over a one-year time frame.
It's pretty evident that a longer time frame will make the bigger stores more profitable, by providing more time to offset upfront costs. If we extend our time frame to two years, we can see the point when each option becomes more profitable (for this part I'll stick to the 4% growth rate).
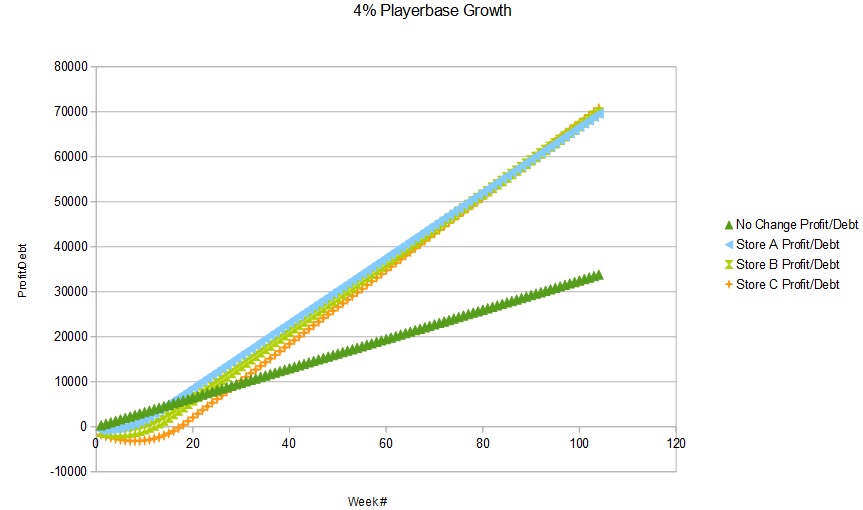
The key points to look for are when each store 1) surpasses the no change option; and 2) surpasses the other stores.
It's hard to see on the graph, but those points are the following:
- Store A is better than no change at week 15.
- Store B is better than no change at week 22; and better than Store A at week 97.
- Store C is better than no change at week 30; better than Store A at week 92; and better than Store B at week 89.
This information is crucial because it allows you to make a decision with normalized information.
Store A is clearly the best option for those who plan on moving within a year, because Store B doesn't outperform A until almost two years in, and by that point Store C is better than both. Your best options are actually limited to Store A until week 92, and Store C after week 92.
Remember these key points are entirely dependent on the playerbase growth rate, which our estimate might not capture correctly. The smartest analysis would be to compare the key points of several playerbase growth rates, and then make the most informed decision based on your business's future plans and current cash flow.
Conclusion
Cost justification using cost-benefit analysis is an important aspect of the decision-making process for all businesses. It allows for proper comparison between different options.
There are still assumptions that have to be made, as the future is never certain. But by including as many aspects of the decision as possible (and the associated costs) we can make decisions with the most clarity and confidence.

Extremely interesting article. Nice job!
Thanks Mike. I figured it was an important subject for the store owners (maybe not as much the players), but the basic ideas can be carried over into a lot of things.