Are you a Quiet Speculation member?
If not, now is a perfect time to join up! Our powerful tools, breaking-news analysis, and exclusive Discord channel will make sure you stay up to date and ahead of the curve.
October's haul of major events was just a preview of November. Seven Regional Championships, seven other major tournaments, and dozens of side events the paper data is the most robust it's been all year.
This gives the clearest possible view of what high-level players thought Modern was about, though the results indicate that they didn't quite get it right.
Meanwhile, Magic Online continued to do its thing outside the spotlight. Its data is somewhat concerning but can also be explained by extenuating circumstances. December will be definitive.
The Odd World of Outliers
The data looks very strange this month. You'd think there'd be many outliers, looking at the data tables, but you'd be wrong.
The tests only returned a single outlier, with a very big asterisk. Boros Energy is an outlier on Magic Online, and every test I did was quite definitive on the subject. This is actually very impressive as for the first two weeks of November it was solidly behind Jeskai Blink, but then Blink collapsed. More on that in the analysis section.
As always, outliers are removed from the data analysis but are reported in their correct position on the Tier List.
That asterisk is that Jeskai Blink was literally right on the line between outlier and non-outlier for multiple tests and for both paper and MTGO. Meaning that the population number that was the top of the acceptable, non-outlier range was Blink's population. That's a very strange situation. The most restrictive test consistently pegged it as an outlier, but it was the only one. I didn't remove it, nor Energy in paper despite it also being pegged by a couple tests, because it didn't affect the tier list composition. However, it's a sign that the data is very weird.
November Population Metagame
To make the tier list, a given deck has to beat the overall average population for the month. The average is my estimate for how many results a given deck "should" produce in a given month. To be considered a tiered deck, it must perform better than "good enough". Every deck that posts at least the average number of results is "good enough" and makes the tier list.
Then we go one standard deviation (STdev) above average to set the limit of Tier 3 and the cutoff for Tier 2. This mathematically defines Tier 3 as those decks clustered near the average. Tier 2 goes from the cutoff to the next standard deviation. These are decks that perform well above average. Tier 1 consists of those decks at least two standard deviations above the mean result, encompassing the truly exceptional performing decks.
The MTGO data nearly exclusively comes from official Preliminary, Qualifiers, and Challenge results. Leagues are excluded, as they add analytically useless bulk data to both the population and power tiers. The paper data comes from any source I can find, with all reported events being counted.
While the MTGO events report predictable numbers, paper events can report anything from only the winner to all the results. In the latter case, if match results aren't included, I'll take as much of the Top 32 as possible. If match results are reported, I'll take winning record up to Top 32, and then any additional decks tied with 32nd place, as tiebreakers are a magic most foul and black.
The MTGO Population Data
November's adjusted average population for MTGO is 14.46. I always round down if the decimal is less than .20. Tier 3, therefore, begins with decks posting 15 results. The unadjusted STdev was 29.43, so add 30 and that means Tier 3 runs to 45 results. Again, it's the starting point to the cutoff, then the next whole number for the next Tier. Therefore Tier 2 starts with 46 results and runs to 76. Subsequently, to make Tier 1, 77 decks are required.
The sample population is down from October's 1536 to 1355. There were fewer events scheduled, but also significantly fewer events fired (assuming that all that did were posted). The weekend of the 22nd had 5 RC's and only one Challenge fired when normally there's five. I assume that's down to MTGO's fairly tiny playerbase of dedicated grinders all going to the RCs.
There were also a couple Challenges that fired with the bare minimum number of players, and I didn't take any deck's with losing records.
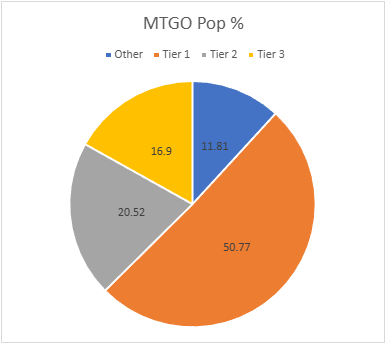
However, unique decks rose slightly, from 73 to 81, yielding an improved but still low unique deck ratio of .060. 20 decks made the Tier List, which is better than October's 17, but it's still well below average for 2025. It looks like the online metagame has thoroughly settled, and now it's about finding edge advantages around the established decks.
| Deck Name | Total # | Total % |
|---|---|---|
| Tier 1 | ||
| Boros Energy | 198 | 14.61 |
| Jeskai Blink | 154 | 11.36 |
| Izzet Prowess | 138 | 10.18 |
| Domain Zoo | 109 | 8.04 |
| Ruby Storm | 89 | 6.57 |
| Tier 2 | ||
| Weapons Affinity | 70 | 5.17 |
| Amulet Titan | 59 | 4.35 |
| Esper Blink | 55 | 4.06 |
| Green-Based Eldrazi | 47 | 3.47 |
| Goryo Blink | 47 | 3.47 |
| Tier 3 | ||
| Broodscale Combo | 38 | 2.80 |
| Simic Ritual | 37 | 2.73 |
| UW Control | 25 | 1.84 |
| Colorless Etron | 23 | 1.70 |
| Sam Ritual | 21 | 1.55 |
| Neobrand | 21 | 1.55 |
| Tameshi Belcher | 18 | 1.33 |
| MB Saga | 16 | 1.18 |
| Izzet Cutter | 15 | 1.11 |
| Yawgmoth | 15 | 1.11 |
As I mentioned above, Jeskai Blink started out very strong, but then abruptly fell off. Boros Energy took up the slack and rose from being in the upper middle of the pack to being an outlier with surprising speed. As mentioned, I'll discuss why in the Analysis section, but there is an additional wrinkle to the tale.
Jeskai Blink Mutated
Successful decks tend to coalesce towards a single "ideal" decklist as they get popular. If that list continues to be successful, there will be minimal variance until a major metagame shift happens.
This is what we've seen with Boros Energy.
However, if that rising list suddenly begins to falter, it will quickly spawn new variants as players try and save the deck through repositioning.
This is happening with Jeskai Blink.
The mainline lists aren't winning like they used to, so more midrange versions appeared, but they fared no better. Different speed means different deck, so the midrange version was listed separately. These variants weren't popular enough that lumping all the version together would have caught Boros, but it would have been closer.
The Paper Population Data
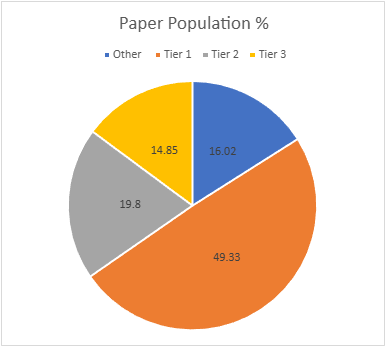
More RCs and more side events mean November's paper population increased from 1020 to 1192. If October set the record for paper data, it was a very short reign. That said, it was down one unique deck to 84 with a ratio of .070. That's still really poor diversity by paper standards. As mentioned last month, a lot of side events have the same players playing the same decks. High-level events also just generally don't showcase innovation as much anymore, so the more of them I have the lower the diversity ends up being.
17 decks made the tier list, up one from October but still low thanks to big gaps in the data. Even removing the borderline outliers would have admitted no additional decks to the Tier List thanks to those gaps. The average population is exactly 14.19 so the List starts at 14. The STDev is 30.28, so the increment is 31. Therefore, Tier 3 runs from 14 to 45, Tier 2 is 46 to 77 and Tier 1 is 78 and over.
| Deck Name | Total # | Total % |
|---|---|---|
| Tier 1 | ||
| Jeskai Blink | 167 | 14.01 |
| Boros Energy | 141 | 11.83 |
| Amulet Titan | 96 | 8.05 |
| Izzet Prowess | 94 | 7.89 |
| Weapons Affinity | 90 | 7.55 |
| Tier 2 | ||
| Simic Ritual | 67 | 5.62 |
| Domain Zoo | 59 | 4.95 |
| Goryo Blink | 57 | 4.78 |
| Broodscale Combo | 53 | 4.45 |
| Tier 3 | ||
| Ruby Storm | 29 | 2.43 |
| Esper Blink | 29 | 2.43 |
| Tameshi Belcher | 23 | 1.93 |
| Green-Based Eldrazi | 23 | 1.93 |
| UW Control | 23 | 1.93 |
| Colorless Etron | 22 | 1.85 |
| Affinity | 14 | 1.17 |
| Yawgmoth | 14 | 1.17 |
As predicted, Amulet Titan fell from the top of the List in November. It did very well but couldn't fend off Jeskai Blink and Boros Energy. Amulet did well at SCG Las Vegas, but there were a lot more non-SCG events to balance out the Star City Games boost Amulet always gets.
I'll also note that Amulet just generally does better in paper than online because clicking through all the loops is quite tedious. The online chess clock is also a problem for Amulet.
November Power Metagame
Tracking the metagame in terms of population is standard practice. But how do results actually factor in? Better decks should also have better results. In an effort to measure this, I use a power ranking system in addition to the prevalence list. By doing so, I measure the relative strengths of each deck within the metagame so that a deck that just squeaks into Top 32 isn't valued the same as one that Top 8's. This better reflects metagame potential.
For the MTGO data, points are awarded based on the population of the event. Preliminaries and similar events award points based on record (1 for 3 wins, 2 for 4 wins, 3 for 5), and Challenges are scored 3 points for the Top 8, 2 for Top 16, and 1 for Top 32. If I can find them, non-Wizards events will be awarded points the same as Challenges or Preliminaries depending on what the event in question reports/behaves like. Super Qualifiers and similar higher-level events get an extra point and so do other events if they’re over 200 players, with a fifth point for going over 400 players.
Due to paper reporting being inconsistent and frequently full of data gaps compared to MTGO, its points work differently. I award points based on the size of the tournament rather than placement. For events with no reported starting population or up to 32 players, one point is awarded to every deck. Events with 33 players up to 128 players get two points. From 129 players up to 512 players get three. Above 512 is four points, and five points is reserved for Modern Pro Tours. When paper reports more than the Top 8, which is rare, I take all the decks with a winning record or tied for Top 32, whichever is pertinent.
The MTGO Power Tiers
As with the population numbers, total points fell to 2473. The adjusted average points were 26.54, therefore 27 points made Tier 3. The STDev was 54.59 so add 55 to the starting point, and Tier 3 runs to 82 points. Tier 2 starts with 83 points and runs to 138. Tier 1 requires at least 139 points. There's a lot of shuffling inside each tier, no movement between tiers, and both Dimir Tempo and Jeskai Energy joined the Tier List.
| Deck Name | Total Points | Total % |
|---|---|---|
| Tier 1 | ||
| Boros Energy | 350 | 14.15 |
| Jeskai Blink | 280 | 11.32 |
| Izzet Prowess | 252 | 10.19 |
| Domain Zoo | 212 | 8.57 |
| Ruby Storm | 172 | 6.95 |
| Tier 2 | ||
| Weapons Affinity | 119 | 4.81 |
| Amulet Titan | 111 | 4.49 |
| Esper Blink | 109 | 4.41 |
| Green-Based Eldrazi | 87 | 3.52 |
| Goryo Blink | 84 | 3.40 |
| Tier 3 | ||
| Simic Ritual | 70 | 2.83 |
| Broodscale Combo | 64 | 2.59 |
| UW Control | 42 | 1.70 |
| Sam Ritual | 42 | 1.70 |
| Neobrand | 37 | 1.50 |
| Tameshi Belcher | 34 | 1.37 |
| Colorless Etron | 33 | 1.33 |
| Yawgmoth | 32 | 1.29 |
| Dimir Tempo | 31 | 1.25 |
| Izzet Cutter | 30 | 1.21 |
| MB Saga | 29 | 1.17 |
| Jeskai Energy | 27 | 1.09 |
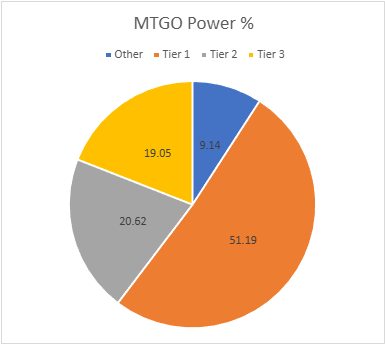
When I say that the metagame is settling and diversity is down, I'm looking at the distribution table. The fact that "Other" is disappearing concerns me. This strongly indicates that there's no exploration and experimentation happening.
Again, there were a lot of high-level events in November and those tend to bring out optimization not innovation. Add in that MTGO incentivizes the same and the tiny sliver in "Other" makes sense, but in past years it never got this small. If this continues into December, Modern has issues.
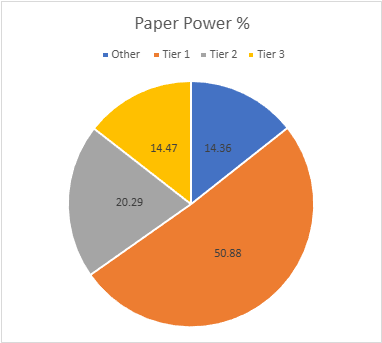
The Paper Power Tiers
Paper's total points are also up from 2024 to 2718. All the RCs being 3- or 4-point events will do that. The average points were 32.36, setting the cutoff at 33 points. The STDev was 71.13, so add 71 to the starting point and Tier 3 runs to 104 points. Tier 2 starts with 105 points and runs to 176. Tier 1 requires at least 177 points. The paper power tier is almost exactly the same as the population tier. Only the bottom two decks traded places.
| Deck Name | Total Points | Total % |
|---|---|---|
| Tier 1 | ||
| Jeskai Blink | 368 | 13.55 |
| Boros Energy | 354 | 13.03 |
| Amulet Titan | 235 | 8.65 |
| Izzet Prowess | 221 | 8.14 |
| Weapons Affinity | 204 | 7.51 |
| Tier 2 | ||
| Simic Ritual | 156 | 5.74 |
| Domain Zoo | 143 | 5.26 |
| Goryo Blink | 134 | 4.93 |
| Broodscale Combo | 118 | 4.34 |
| Tier 3 | ||
| Ruby Storm | 70 | 2.58 |
| Esper Blink | 64 | 2.36 |
| Tameshi Belcher | 47 | 1.73 |
| Green-Based Eldrazi | 47 | 1.73 |
| UW Control | 47 | 1.73 |
| Colorless Etron | 47 | 1.73 |
| Yawgmoth | 36 | 1.32 |
| Affinity | 35 | 1.29 |
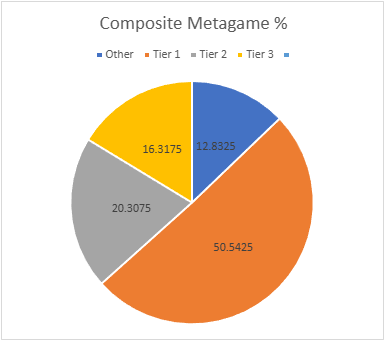
Composite Metagame
That's a lot of data, but what does it all mean? When Modern Nexus was first started, we had a statistical method to combine the MTGO and paper data, but the math of that system doesn't work without big paper events. I tried. Instead, I'm using an averaging system to combine the data. I take the MTGO results and average the tier, then separately average the paper results, then average the paper and MTGO results together for final tier placement.
This generates a lot of partial Tiers. That's not a bug, but a feature. The nuance separates the solidly Tiered decks from the more flexible ones and shows the true relative power differences between the decks. Every deck in the paper and MTGO results is on the table, and when they don't appear in a given category, they're marked N/A. This is treated as a 4 for averaging purposes.
| Deck Name | MTGO Pop Tier | MTGO Power Tier | MTGO Average Tier | Paper Pop Tier | Paper Power Tier | Paper Average Tier | Composite Tier |
|---|---|---|---|---|---|---|---|
| Boros Energy | 1 | 1 | 1 | 1 | 1 | 1 | 1.00 |
| Jeskai Blink | 1 | 1 | 1 | 1 | 1 | 1 | 1.00 |
| Izzet Prowess | 1 | 1 | 1 | 1 | 1 | 1 | 1.00 |
| Domain Zoo | 1 | 1 | 1 | 2 | 2 | 2 | 1.50 |
| Weapons Affinity | 2 | 2 | 2 | 1 | 1 | 1 | 1.50 |
| Amulet Titan | 2 | 2 | 2 | 1 | 1 | 1 | 1.50 |
| Ruby Storm | 1 | 1 | 1 | 3 | 3 | 3 | 2.00 |
| Goryo Blink | 2 | 2 | 2 | 2 | 2 | 2 | 2.00 |
| Esper Blink | 2 | 2 | 2 | 3 | 3 | 3 | 2.50 |
| Green-Based Eldrazi | 2 | 2 | 2 | 3 | 3 | 3 | 2.50 |
| Broodscale Combo | 3 | 3 | 3 | 2 | 2 | 2 | 2.50 |
| Simic Ritual | 3 | 3 | 3 | 2 | 2 | 2 | 2.50 |
| UW Control | 3 | 3 | 3 | 3 | 3 | 3 | 3.00 |
| Colorless Etron | 3 | 3 | 3 | 3 | 3 | 3 | 3.00 |
| Neobrand | 3 | 3 | 3 | 3 | 3 | 3 | 3.00 |
| Yawgmoth | 3 | 3 | 3 | 3 | 3 | 3 | 3.00 |
| Affinity | N/A | N/A | N/A | 3 | 3 | 3 | 3.50 |
| Sam Ritual | 3 | 3 | 3 | N/A | N/A | N/A | 3.50 |
| Tameshi Belcher | 3 | 3 | 3 | N/A | N/A | N/A | 3.50 |
| Mono-Black Saga | 3 | 3 | 3 | N/A | N/A | N/A | 3.50 |
| Izzet Cutter | 3 | 3 | 3 | N/A | N/A | N/A | 3.50 |
| Dimir Tempo | N/A | 3 | 3.5 | N/A | N/A | N/A | 3.75 |
| Jeskai Energy | N/A | 3 | 3.5 | N/A | N/A | N/A | 3.75 |
Average Power Rankings
Finally, we come to the average power rankings. These are found by taking the total points earned and dividing them by total decks, to measure points per deck. I use this to measure strength vs. popularity. Measuring deck strength is hard. While you can make a Wins-Above-Replacement-esq metric for the Magic cards in an individual deck, there's no way to make one that lets you compare decks. The game is too complex, and even then, power is very contextual.
Using the power rankings helps to show how justified a deck’s popularity is. However, more popular decks will still necessarily earn a lot of points. Therefore, the top tier doesn't move much between population and power and obscures whether its decks really earned their position.
This is where the averaging comes in. Decks that earn a lot of points because they get a lot of results will do worse than decks that win more events, indicating which deck actually performs better.
A higher average indicates lots of high finishes, whereas low averages result from mediocre performances and a high population. Lower-tier decks typically do very well here, likely due to their pilots being enthusiasts. Bear this in mind and be careful about reading too much into these results. However, as a general rule, decks that place above the baseline average are over-performing, and vice versa.
How far above or below that average a deck sits justifies its position on the power tiers. Decks well above baseline are undervalued, while decks well below baseline are very popular, but aren't necessarily good.
The Real Story
When considering the average points, the key is looking at how far off a deck is from the Baseline stat (the overall average of points/population). The closer a deck’s performance to the Baseline, the more likely it is to be performing close to its "true" potential.
A deck that is exactly average would therefore perform exactly as well as expected. The greater the deviation from the average, the more a deck under or over-performs. On the low end, a deck’s placing was mainly due to population rather than power, which suggests it’s overrated. A high-scoring deck is the opposite of this.
We'll start with MTGO's averages:
| Deck Name | Total Points | Power Tier |
|---|---|---|
| Jeskai Energy | 2.25 | 3 |
| Dimir Tempo | 2.21 | 3 |
| Yawgmoth | 2.13 | 3 |
| Sam Ritual | 2.00 | 3 |
| Izzet Cutter | 2.00 | 3 |
| Esper Blink | 1.98 | 2 |
| Domain Zoo | 1.94 | 1 |
| Ruby Storm | 1.93 | 1 |
| Simic Ritual | 1.89 | 3 |
| Tameshi Belcher | 1.89 | 3 |
| Amulet Titan | 1.88 | 2 |
| Green-Based Eldrazi | 1.85 | 2 |
| Izzet Prowess | 1.83 | 1 |
| Jeskai Blink | 1.82 | 1 |
| MB Saga | 1.81 | 3 |
| Goryo Blink | 1.79 | 2 |
| Boros Energy | 1.77 | 1 |
| Neobrand | 1.76 | 3 |
| Baseline | 1.70 | |
| Weapons Affinity | 1.70 | 2 |
| Broodscale Combo | 1.68 | 3 |
| UW Control | 1.68 | 3 |
| Colorless Etron | 1.43 | 3 |
Congratulations to Domain Zoo for being the best performing Tier 1 deck and therefore the MTGO Deck of November. Did not see that coming, I don't think it's been close to the top before.
| Deck Name | Average Points | Power Tier |
|---|---|---|
| Yawgmoth | 2.57 | 3 |
| Boros Energy | 2.51 | 1 |
| Affinity | 2.50 | 3 |
| Amulet Titan | 2.45 | 1 |
| Domain Zoo | 2.42 | 2 |
| Ruby Storm | 2.41 | 3 |
| Izzet Prowess | 2.35 | 1 |
| Goryo Blink | 2.35 | 2 |
| Simic Ritual | 2.33 | 2 |
| Weapons Affinity | 2.27 | 1 |
| Broodscale Combo | 2.23 | 2 |
| Esper Blink | 2.21 | 3 |
| Jeskai Blink | 2.20 | 1 |
| Colorless Etron | 2.14 | 3 |
| Baseline | 2.05 | |
| Tameshi Belcher | 2.04 | 3 |
| Green-Based Eldrazi | 2.04 | 3 |
| UW Control | 2.04 | 3 |
In a far more expected move, Boros Energy wins Paper Deck of November. Being the best pays, who knew?
Analysis
The headline story is Jeskai Blink's rise and fall. The deck appeared in late October, exploding onto MTGO. It arrived too late to make it into paper's high tiers, but it did put up some decent results. During the first week and a half of November it continued its meteoric rise to the top of the standings.
Then it just... stopped.
It just stopped showing up in Challenges before getting a steady trickle of results. Its strong start let it hold onto second place as Energy surged back into first. It was the same story in paper, but the lead there was too extreme for Energy to catch.
The problem with the deck is a mix of a structural problem and metagame adaptation. Jeskai Blink lives and dies on whether Consign to Memory is good. Initially, it had no other non-battlefield interaction. Many now run a maindeck pair of Strix Serenade against the mirror, but the point stands.
The deck is designed to utterly dominate the battlefield with spot removal, Phlage, Titan of Fire's Fury and Solitude. Decks that don't win via combat just ignore Jeskai Blink, and it's too slow to race anything. If Consign can't save it, the deck has no chance. This is why Ruby Storm did well in November.
Jeskai Exposed
However, that's not the full story on Jeskai's structural weakness.
The issue is that it doesn't want to Consign anything the opponent does. It wants, and I'd argue needs, to Consign the sacrifice trigger on evoked Solitudes and non-escaped Phlages or the warp trigger on Quantum Riddler to be competitive. If it isn't cheating one of those into play, it has Ragavan and a bunch of three-drops. Phelia too I suppose, but the corgi just isn't good on its own.
The deck is good when it's able to get a continuous stream of value by blinking things it cheated in. When that isn't happening, it's just a durdley midrange deck.
I've only gathered a week of data for December so far, but it looks like Blink is still declining. I'm not surprised. All the Blink decks are at their core durdley engine decks.
However, BW and Esper Blink play more cheap creatures and can apply pressure even when the engines aren't running.
Outside Ragavan randomly going all the way, Jeskai can't pressure anyone. It has to overwhelm its opponents. Once players realized that they adapted. It started with Ruby Storm seeing a lot more play and success.
Combo in general is a good plan against durdling and having a combo that doesn't just lose to Consign is very good.
Increasingly, Simic Ritual began rising to destroy Blink. It turns out that in a fight between value decks, creatures that 2-for-1 by themselves are better than creatures that need help. Also, countering spells is strong, especially when Jeskai is vulnerable to Harbinger of the Seas. I've had considerable success with Jeskai Control by just Counterspell[card]ing Riddler and using [card]Supreme Verdict to clean up the board.
Jeskai Blink is an old-school board control deck, and traditionally those decks can't handle combo or true control. I haven't seen anything to think Blink is different, and apparently, it's not even that good at board control as Energy has a 50/50 matchup against it.
Is Modern Healthy?
Whether Modern is healthy is entirely dependent on your point of view. Boros Energy's continued dominance of the online metagame coupled with a resurgence in paper plus decreased diversity suggest that Modern is unhealthy.
On the other, the metagame is constantly cycling as the recent rise and fall of Jeskai Blink attests.
It comes down to whether you want a Modern where all the decks are known and predictable or where you want there to be more brewing and surprise. The former is fine with this metagame while the latter is getting increasingly frustrated.
The wrinkle in this analysis is Amulet Titan.
It's not too powerful, but it is causing tournament logistics issues. Both US RCs went hours over time, and I'm reliably informed it was mostly Titan's fault. The rumor mill says that it was the same story in the other RCs, but I have no direct confirmation.
Wizards was already watching Titan for this after Houston, so it happening in Las Vegas too has likely made up their mind. If Wizards chooses to take action against Titan, it increases the chances for more action, likely against Boros. However, we have until February to idly speculate.
Financial Implications
Avatar: the Last Airbender is suffering similar supply issues to Edge of Eternities, according to my LGS sources. This has meant that the price of sealed product has been decently high, as predicted.
However, both product and card prices are beginning to gradually fall. The set is significantly weaker than Edge, so demand is down. Additionally, many stores planned ahead and ordered more product in the initial run, so the supply drought isn't as bad.
Couple this with the typical decrease in card demand at the end of the year and there's not much opportunity for speculative gain until the next set release. I'd be focused on building inventory, especially since Standard will be the competitive focus for a while.
