
Are you a Quiet Speculation member?
If not, now is a perfect time to join up! Our powerful tools, breaking-news analysis, and exclusive Discord channel will make sure you stay up to date and ahead of the curve.
The shortest month of the year is usually pretty quiet, metagame-wise. It's a weird spot in the events calendar and normally just continues trends from January.
That's only kinda-true this time.
While the main trend from January does continue, there was a surprising amount of innovation happening throughout the metagame. Unfortunately, that primary trend is a lot stronger than the countervailing innovation.
There was also a scare when Daybreak gave in to pressure from Hasbro's lawyers and further restricted the release of Challenge data. Fortunately, the community roared them into submission, and they reversed the policy three days later.
I wasn't sure if this series could continue if they hadn't, but it does mean I'll have plenty of time to prepare my open letter/master's thesis on the subject, working title "I have the data that proves you're completely wrong to restrict Magic data" for when they try this idiocy again.
Mildly Insane Outliers
That continuing trend is Boros Energy blowing every other deck away. It was a massive outlier in January, and it is again in February. However, the margin has increased. In January Boros Energy had 1.82 times as many placings as second place Ruby Storm on Magic Online and was 1.02 times greater than Izzet Prowess in paper. In February, Energy outstripped Storm online by 1.91 times and was 2.96 times greater than Weapons Affinity in paper. Energy only needed higher average points higher to be Tier 0 in paper. It's getting out of control.
Ruby Storm was also an outlier online. That doesn't feel as pressing a thing as what Energy's doing. As always, outliers are removed from the statistical analysis but are presented in their correct place on the Tier List.
February Population Metagame
To make the tier list, a given deck has to beat the overall average population for the month. The average is my estimate for how many results a given deck "should" produce in a given month. To be considered a tiered deck, it must perform better than "good enough". Every deck that posts at least the average number of results is "good enough" and makes the tier list.
Then we go one standard deviation (STdev) above average to set the limit of Tier 3 and the cutoff for Tier 2. This mathematically defines Tier 3 as those decks clustered near the average. Tier 2 goes from the cutoff to the next standard deviation. These are decks that perform well above average. Tier 1 consists of those decks at least two standard deviations above the mean result, encompassing the truly exceptional performing decks.
The MTGO data nearly exclusively comes from official Preliminary, Qualifiers, and Challenge results. Leagues are excluded, as they add analytically useless bulk data to both the population and power tiers. The paper data comes from any source I can find, with all reported events being counted.
While the MTGO events report predictable numbers, paper events can report anything from only the winner to all the results. In the latter case, if match results aren't included, I'll take as much of the Top 32 as possible. If match results are reported, I'll take winning record up to Top 32, and then any additional decks tied with 32nd place, as tiebreakers are a magic most foul and black.
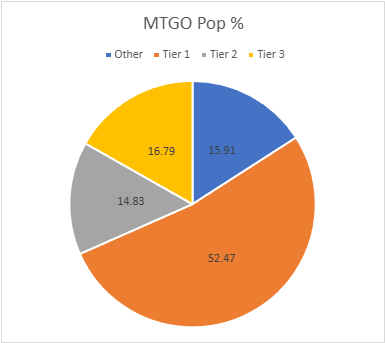
The MTGO Population Data
February's adjusted average population for MTGO is 10.38. I always round down if the decimal is less than .20. Tier 3, therefore, begins with decks posting 11 results. The adjusted STdev was 17.19, so add 17 and that means Tier 3 runs to 28 results. Again, it's the starting point to the cutoff, then the next whole number for the next Tier. Therefore Tier 2 starts with 29 results and runs to 46. Subsequently, to make Tier 1, 47 decks are required.
The sample population is down up from January 1536 to 1376. February is always a smaller dataset than January due to being three days shorter, but it also didn't have as many extra events as January. Again, this is typical, nothing really to see here. However, unique decks actually rose from 96 to 102, yielding a unique deck ratio of .0741, which is pretty high for MTGO. The Modern RCQ season starts in April, so players are getting experimental. 26 decks made the Tier List, which is down from January.
| Deck Name | Total # | Total % |
|---|---|---|
| Tier 1 | ||
| Boros Energy | 222 | 16.13 |
| Ruby Storm | 116 | 8.43 |
| Colorless Etron | 81 | 5.89 |
| Jeskai Blink | 79 | 5.74 |
| Dimir Control | 77 | 5.59 |
| Green-Based Eldrazi | 50 | 3.63 |
| Living End | 50 | 3.63 |
| Domain Zoo | 47 | 3.42 |
| Tier 2 | ||
| Weapons Affinity | 45 | 3.27 |
| Amulet Titan | 44 | 3.20 |
| Neobrand | 44 | 3.20 |
| Izzet Prowess | 41 | 2.98 |
| Goryo Blink | 30 | 2.18 |
| Tier 3 | ||
| Esper Blink | 28 | 2.03 |
| Simic Ritual | 26 | 1.89 |
| Grixis Reanimator | 24 | 1.74 |
| Tameshi Belcher | 22 | 1.60 |
| Yawgmoth | 21 | 1.53 |
| Kappa's Cannons | 19 | 1.38 |
| Broodscale Combo | 17 | 1.23 |
| Izzet Cutter | 15 | 1.09 |
| Dimir Tempo | 14 | 1.02 |
| BW Blink | 12 | 0.87 |
| Necro | 11 | 0.80 |
| Mill | 11 | 0.80 |
| Miracles | 11 | 0.80 |
So, yeah. Here's the numbers behind what I wrote in the Outliers section. I'm writing this on March 8th having just added the day's Challenges to the Excel sheet, and Energy's population is sitting at 106 decks representing 22.04% of the Modern metagame. Ruby Storm and Jeskai Blink are tied for second with 37 decks and 7.69% of the metagame. There aren't enough paper events to make any judgements, yet. I'll withhold further commentary until the Analysis section.
In other news, Dimir Control exploded onto the scene in February. We've had creature-heavy Dimir Tempo decks for quite a while, but for some reason players decided to ditch Psychic Frog and play a much harder control game. It clearly worked out, but I do question how long it's going to last. Frog gives a deck quite a bit of forgiveness, but the Control deck has none. If you're thinking of running it, you'd better be as good as you think you are because every decision Matters.
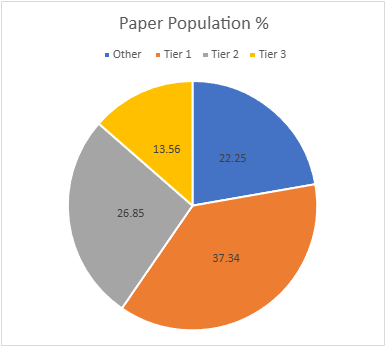
The Paper Population Data
February's paper data surprised me. It's a smaller month with yet another Prerelease, so I expected the data to be down significantly. That wasn't the case. The population did fall, but only from 403 to 391, which is a very good sign for Modern's popularity. Unique decks also fell slightly from 75 to 70 for a ratio of .179, which is pretty good for paper. Despite everything else this gives me hope for an interesting and dynamic RCQ season.
19 decks made the tier list, also down a bit from January. The adjusted average population is 4.72 so the List starts at 5. The STDev is 5.189, so the increment is 6. Therefore, Tier 3 runs from 5 to 11, Tier 2 is 12 to 18 and Tier 1 is 19 and over. This is exactly the same as it was in January. Make of that what you will.
| Deck Name | Total # | Total % |
|---|---|---|
| Tier 1 | ||
| Boros Energy | 65 | 16.62 |
| Weapons Affinity | 22 | 5.63 |
| Domain Zoo | 21 | 5.37 |
| Goryo Blink | 19 | 4.86 |
| Tameshi Belcher | 19 | 4.86 |
| Tier 2 | ||
| Izzet Prowess | 18 | 4.60 |
| Esper Blink | 17 | 4.35 |
| Colorless Etron | 17 | 4.35 |
| Green-Based Eldrazi | 14 | 3.58 |
| Amulet Titan | 13 | 3.32 |
| Simic Ritual | 13 | 3.32 |
| Jeskai Blink | 13 | 3.32 |
| Tier 3 | ||
| Ruby Storm | 11 | 2.81 |
| Yawgmoth | 11 | 2.81 |
| Broodscale Combo | 7 | 1.79 |
| Living End | 7 | 1.79 |
| Neobrand | 6 | 1.53 |
| Dimir Tempo | 6 | 1.53 |
| Mill | 5 | 1.28 |
February 2026 is a perfect example of the differences between the online and in-person metagames. Most of paper's Tier 1 is decks that are Tier 2 online. Jeskai Blink is one of the online metagame's darlings and also performs really well on points, but in paper it's just barely Tier 2. Ruby Storm also performs a lot worse here, mostly because keeping track of mana and storm count is harder in paper than online. Dimir Control didn't even show up. Never forget that the online world is not your local metagame.
Something else to consider is that despite the hype around it, no Moonshadow deck cracked the Tier List. There was no lack of decks trying to make it work, but even if I'd combined all the versions into one deck, Moonshadow would just barely make MTGO's Tier 3 and would still be untiered in paper. I know players really want it to work, but so far it just doesn't.
February Power Metagame
Tracking the metagame in terms of population is standard practice. But how do results actually factor in? Better decks should also have better results. In an effort to measure this, I use a power ranking system in addition to the prevalence list. By doing so, I measure the relative strengths of each deck within the metagame so that a deck that just squeaks into Top 32 isn't valued the same as one that Top 8's. This better reflects metagame potential.
For the MTGO data, points are awarded based on the population of the event. Preliminaries and similar events award points based on record (1 for 3 wins, 2 for 4 wins, 3 for 5), and Challenges are scored 3 points for the Top 8, 2 for Top 16, and 1 for Top 32. If I can find them, non-Wizards events will be awarded points the same as Challenges or Preliminaries depending on what the event in question reports/behaves like. Super Qualifiers and similar higher-level events get an extra point and so do other events if they’re over 200 players, with a fifth point for going over 400 players.
Due to paper reporting being inconsistent and frequently full of data gaps compared to MTGO, its points work differently. I award points based on the size of the tournament rather than placement. For events with no reported starting population or up to 32 players, one point is awarded to every deck. Events with 33 players up to 128 players get two points. From 129 players up to 512 players get three. Above 512 is four points, and five points is reserved for Modern Pro Tours. When paper reports more than the Top 8, which is rare, I take all the decks with a winning record or tied for Top 32, whichever is pertinent.
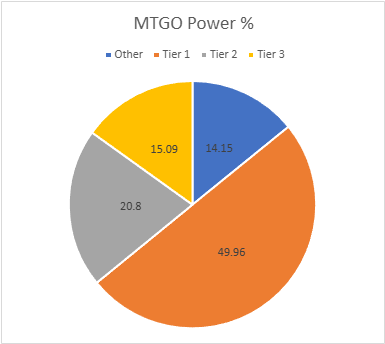
The MTGO Power Tiers
As with the population numbers, total points fell from 2752 to 2438. The adjusted average points were 18.39 therefore 19 points made Tier 3. The adjusted STDev was 31.77 so add 32 to the starting point, and Tier 3 runs to 51 points. Tier 2 starts with 52 points and runs to 84. Tier 1 requires at least 85 points. There's a lot of movement inside each tier and between tiers, and Necro fell off, replaced by Eldrazi Breach.
| Deck Name | Total Points | Total % |
|---|---|---|
| Tier 1 | ||
| Boros Energy | 395 | 16.20 |
| Ruby Storm | 204 | 8.37 |
| Colorless Etron | 156 | 6.40 |
| Jeskai Blink | 152 | 6.23 |
| Dimir Control | 135 | 5.54 |
| Living End | 90 | 3.69 |
| Green-Based Eldrazi | 86 | 3.52 |
| Tier 2 | ||
| Domain Zoo | 84 | 3.44 |
| Weapons Affinity | 82 | 3.36 |
| Amulet Titan | 78 | 3.20 |
| Neobrand | 75 | 3.08 |
| Izzet Prowess | 73 | 2.99 |
| Esper Blink | 59 | 2.42 |
| Goryo Blink | 56 | 2.30 |
| Tier 3 | ||
| Simic Ritual | 48 | 1.97 |
| Tameshi Belcher | 41 | 1.68 |
| Grixis Reanimator | 38 | 1.56 |
| Yawgmoth | 37 | 1.52 |
| Kappa's Cannons | 34 | 1.39 |
| Broodscale Combo | 34 | 1.39 |
| Izzet Cutter | 28 | 1.15 |
| Dimir Tempo | 28 | 1.15 |
| Mill | 21 | 0.86 |
| BW Blink | 20 | 0.82 |
| Miracles | 20 | 0.82 |
| Eldrazi Breach | 19 | 0.78 |
The Ephemerate decks are in a really weird spot. Jeskai Blink is the best performing deck by far, yet both the older versions have returned to the metagame. While I can't definitively say why this is happening, I do know that Jeskai Blink has always felt strange to me.
It feels like its being pulled in a lot of different directions and towards different speeds, an unwieldly compromise deck held together by Quantum Riddler and Consign to Memory.
Meanwhile, both Esper and BW Blink are straight midrange-value decks and a lot easier to pilot.
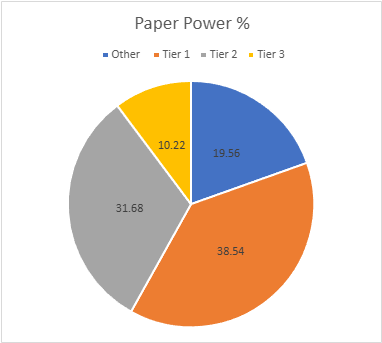
The Paper Power Tiers
Paper's total points actually rose from 615 to 684. The adjusted average points were 8.20, setting the cutoff at 8 points. The STDev was 10.83, so add 11 to the starting point and Tier 3 runs to 19 points. Tier 2 starts with 20 points and runs to 31. Tier 1 requires at least 32 points. Again, there's a lot of movement between the population and power tiers. Mill fell off and was replaced by Kappa's Cannons.
| Deck Name | Total Points | Total % |
|---|---|---|
| Tier 1 | ||
| Boros Energy | 118 | 17.25 |
| Domain Zoo | 39 | 5.70 |
| Weapons Affinity | 38 | 5.55 |
| Tameshi Belcher | 36 | 5.26 |
| Goryo Blink | 33 | 4.82 |
| Tier 2 | ||
| Izzet Prowess | 31 | 4.53 |
| Ruby Storm | 29 | 4.24 |
| Green-Based Eldrazi | 28 | 4.09 |
| Colorless Etron | 27 | 3.95 |
| Esper Blink | 26 | 3.80 |
| Amulet Titan | 26 | 3.80 |
| Simic Ritual | 25 | 3.65 |
| Jeskai Blink | 25 | 3.65 |
| Tier 3 | ||
| Yawgmoth | 15 | 2.19 |
| Living End | 13 | 1.90 |
| Broodscale Combo | 12 | 1.75 |
| Neobrand | 12 | 1.75 |
| Kappa's Cannons | 10 | 1.46 |
| Dimir Tempo | 8 | 1.17 |
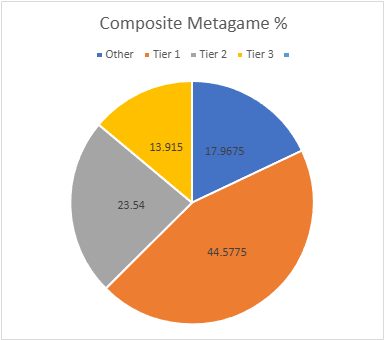
Composite Metagame
That's a lot of data, but what does it all mean? When Modern Nexus was first started, we had a statistical method to combine the MTGO and paper data, but the math of that system doesn't work without big paper events. I tried. Instead, I'm using an averaging system to combine the data. I take the MTGO results and average the tier, then separately average the paper results, then average the paper and MTGO results together for final tier placement.
This generates a lot of partial Tiers. That's not a bug, but a feature. The nuance separates the solidly Tiered decks from the more flexible ones and shows the true relative power differences between the decks. Every deck in the paper and MTGO results is on the table, and when they don't appear in a given category, they're marked N/A. This is treated as a 4 for averaging purposes.
| Deck Name | MTGO Pop Tier | MTGO Power Tier | MTGO Average Tier | Paper Pop Tier | Paper Power Tier | Paper Average Tier | Composite Tier |
|---|---|---|---|---|---|---|---|
| Boros Energy | 1 | 1 | 1 | 1 | 1 | 1 | 1.00 |
| Domain Zoo | 1 | 2 | 1.5 | 1 | 1 | 1 | 1.25 |
| Colorless Etron | 1 | 1 | 1 | 2 | 2 | 2 | 1.50 |
| Jeskai Blink | 1 | 1 | 1 | 2 | 2 | 2 | 1.50 |
| Green-Based Eldrazi | 1 | 1 | 1 | 2 | 2 | 3 | 1.50 |
| Weapons Affinity | 2 | 2 | 2 | 1 | 1 | 1 | 1.50 |
| Goryo Blink | 2 | 2 | 2 | 1 | 1 | 1 | 1.50 |
| Ruby Storm | 1 | 1 | 1 | 3 | 2 | 2.5 | 1.75 |
| Living End | 1 | 1 | 1 | 3 | 3 | 3 | 2.00 |
| Amulet Titan | 2 | 2 | 2 | 2 | 2 | 2 | 2.00 |
| Izzet Prowess | 2 | 2 | 2 | 2 | 2 | 2 | 2.00 |
| Tameshi Belcher | 3 | 3 | 3 | 1 | 1 | 1 | 2.00 |
| Esper Blink | 3 | 2 | 2.5 | 2 | 2 | 2 | 2.25 |
| Dimir Control | 1 | 1 | 1 | N/A | N/A | N/A | 2.50 |
| Neobrand | 2 | 2 | 2 | 3 | 3 | 3 | 2.50 |
| Simic Ritual | 3 | 3 | 3 | 2 | 2 | 2 | 2.50 |
| Yawgmoth | 3 | 3 | 3 | 3 | 3 | 3 | 3.00 |
| Broodscale Combo | 3 | 3 | 3 | 3 | 3 | 3 | 3.00 |
| Dimir Tempo | 3 | 3 | 3 | 3 | 3 | 3 | 3.00 |
| Kappa's Cannons | 3 | 3 | 3 | N/A | 3 | 3.5 | 3.25 |
| Mill | 3 | 3 | 3 | 3 | N/A | 3.5 | 3.25 |
| Grixis Reanimator | 3 | 3 | 3 | N/A | N/A | N/A | 3.50 |
| Izzet Cutter | 3 | 3 | 3 | N/A | N/A | N/A | 3.50 |
| BW Blink | 3 | 3 | 3 | N/A | N/A | N/A | 3.50 |
| Miracles | 3 | 3 | 3 | N/A | N/A | N/A | 3.50 |
| Necro | 3 | N/A | 3.5 | N/A | N/A | N/A | 3.75 |
| Eldrazi Breach | N/A | 3 | 3.5 | N/A | N/A | N/A | 3.75 |
Average Power Rankings
Finally, we come to the average power rankings. These are found by taking the total points earned and dividing them by total decks, to measure points per deck. I use this to measure strength vs. popularity. Measuring deck strength is hard. While you can make a Wins-Above-Replacement-esq metric for the Magic cards in an individual deck, there's no way to make one that lets you compare decks. The game is too complex, and even then, power is very contextual.
Using the power rankings helps to show how justified a deck’s popularity is. However, more popular decks will still necessarily earn a lot of points. Therefore, the top tier doesn't move much between population and power and obscures whether its decks really earned their position.
This is where the averaging comes in. Decks that earn a lot of points because they get a lot of results will do worse than decks that win more events, indicating which deck actually performs better.
A higher average indicates lots of high finishes, whereas low averages result from mediocre performances and a high population. Lower-tier decks typically do very well here, likely due to their pilots being enthusiasts. Bear this in mind and be careful about reading too much into these results. However, as a general rule, decks that place above the baseline average are over-performing, and vice versa.
How far above or below that average a deck sits justifies its position on the power tiers. Decks well above baseline are undervalued, while decks well below baseline are very popular, but aren't necessarily good.
The Real Story
When considering the average points, the key is looking at how far off a deck is from the Baseline stat (the overall average of points/population). The closer a deck’s performance to the Baseline, the more likely it is to be performing close to its "true" potential.
A deck that is exactly average would therefore perform exactly as well as expected. The greater the deviation from the average, the more a deck under or over-performs. On the low end, a deck’s placing was mainly due to population rather than power, which suggests it’s overrated. A high-scoring deck is the opposite of this.
We'll start with MTGO's averages:
| Deck Name | Average Points | Power Tier |
|---|---|---|
| Esper Blink | 2.11 | 2 |
| Eldrazi Breach | 2.11 | 3 |
| Broodscale Combo | 2.00 | 3 |
| Dimir Tempo | 2.00 | 3 |
| Colorless Etron | 1.93 | 1 |
| Jeskai Blink | 1.92 | 1 |
| Mill | 1.91 | 3 |
| Goryo Blink | 1.87 | 2 |
| Izzet Cutter | 1.87 | 3 |
| Tameshi Belcher | 1.86 | 3 |
| Simic Ritual | 1.85 | 3 |
| Weapons Affinity | 1.82 | 2 |
| Miracles | 1.82 | 3 |
| Living End | 1.80 | 1 |
| Domain Zoo | 1.79 | 2 |
| Kappa's Cannons | 1.79 | 3 |
| Boros Energy | 1.78 | 1 |
| Izzet Prowess | 1.78 | 2 |
| Amulet Titan | 1.77 | 2 |
| Ruby Storm | 1.76 | 1 |
| Yawgmoth | 1.76 | 3 |
| Dimir Control | 1.75 | 1 |
| Green-Based Eldrazi | 1.72 | 1 |
| Neobrand | 1.70 | 2 |
| BW Blink | 1.67 | 3 |
| Necro | 1.64 | N/A |
| Baseline | 1.59 | |
| Grixis Reanimator | 1.58 | 3 |
As the top averaging Tier 1 deck, Colorless Etron wins MTGO Deck of February.
And now for the paper averages:
| Deck Name | Average Points | Total % |
|---|---|---|
| Ruby Storm | 2.64 | 2 |
| Dimir Tempo | 2.50 | 3 |
| Colorless Etron | 2.00 | 2 |
| Simic Ritual | 2.00 | 2 |
| Kappa's Cannons | 2.00 | 3 |
| Jeskai Blink | 1.92 | 2 |
| Yawgmoth | 1.92 | 3 |
| Tameshi Belcher | 1.89 | 1 |
| Domain Zoo | 1.86 | 1 |
| Broodscale Combo | 1.86 | 3 |
| Boros Energy | 1.81 | 1 |
| Goryo Blink | 1.74 | 1 |
| Weapons Affinity | 1.73 | 1 |
| Izzet Prowess | 1.72 | 2 |
| Neobrand | 1.71 | 3 |
| Baseline | 1.63 | |
| Esper Blink | 1.59 | 2 |
| Amulet Titan | 1.53 | 2 |
| Living End | 1.36 | 3 |
| Green-Based Eldrazi | 1.33 | 2 |
| Mill | 1.20 | N/A |
Meanwhile, Tameshi Belcher wins paper Deck of February. I'd guess the good Energy matchup is why.
Analysis
The evidence has been building for a year-and-a-half now, but there's really no challenging Boros Energy. You can beat it in an individual match and even over the course of a tournament, but eventually, Energy always wins. You just can't beat it over the long-term. Based on what's currently happening in March, that isn't changing.
Several people have told me that there's another banlist window at the end of March, but I've never seen an official post from Wizards about that. If there isn't or Wizards again chooses to do nothing, the metagame you've seen today will be the RCQ season's metagame. I'd advise getting really good at playing the Energy mirror. The current data strongly indicates that you'll be playing a lot of it.
Alternatively, you can play one of the very small number of decks with a genuinely good matchup against Energy. However, based on the data from MTGDecks, most of them are only slightly bad and are really more within the margin of error of being even. The only two that have enough data to be legitimately considered bad are Tameshi Belcher and Neobrand, with the latter being Energy's worst matchup. I don't like that it takes something as degenerate as Neobrand to beat Energy, and even then, it still wins 40% of the time.
Something Should Change
I've made no secret that I think something more should be banned from Energy. We didn't used to tolerate decks being this dominant for this long. Every site that I know about which tracks comprehensive metagame data tells the same story: Boros Energy is almost twice as prevalent as the next best deck, and that lead is increasing.
We've had since 2024 to find a solution and haven't, so safe to say there's no in-metagame solution to Energy dominating Modern. Teenage Mutant Ninja Turtles was sufficiently weak that's not going to change and I can't imagine...whatever the next set is?...is going to change anything.
It seems I'm so done with the constant set releases I can't be bothered to look up the next one. That's a bad sign.
Thus, I'm really hoping that the players are right and there is another ban window in March.
Wizards should do something about Energy. It will just dominate the RCQ season otherwise. It's just so good at being both aggro and midrange. Nothing can compete in either space with Energy. The only option is going over the top with combo. I'm fine with having Storm-type combo in the metagame. However, when the best choice is Neobrand, that's a problem. Unfair is fine, degenerate is not.
The Other Decks
I was very surprised that Amulet Titan didn't get banned on February 9th. Wizards said it was causing tournament logistics issues back in November, and to the best of my knowledge that didn't change in the intervening months. Perhaps Titan's decline in the overall metagame took the pressure off? Or maybe there really is another ban window in March and Wizards was just holding off until then. I've no idea.
Powerwise, Amulet Titan definitely isn't a problem. However, the deck's complexity is becoming more of an issue. Amulet's always been the most complicated deck in Modern, possibly in all competitive Magic. However, it used to be easy to understand. The Shifting Woodland loops are on another difficulty level. They're not even that easy to execute for experienced players. Something probably needs to happen there.
There is a lot of hate for the Ephemerate decks. I get it. The data doesn't support banning anything from those decks. However, we should still be talking about them. If Energy gets a ban, Blink could easily get dangerously prevalent. I also think that Jeskai Blink convincingly shows that Consign to Memory is much stronger than intended. Arguably dangerously so.
However, without Consign, Eldrazi decks would definitely be prevalent enough to challenge Boros. Consign is very good at the job it was designed for. Consign might be on the chopping block in a vacuum, but if that happens then Eldrazi will have to eat multiple bans. I'd start with Kozilek's Command.
The Positives
For all that, the metagame still has glimmers of innovation. In January we had a new combo deck built around Devoted Druid, Leyline of Abundance, and Badgermole Cub. It was doing ok during the first week of February before vanished. Just completely disappeared. I'm not sure exactly what happened, but it was being carried by only two players so maybe they just got bored.
February saw the aforementioned Dimir Control deck emerge, but also saw old contenders return. Breach Eldrazi was briefly a major metagame player but couldn't really hang with Solitude and Consign. It's made a comeback largely by adopting the old Legacy Show and Tell strategy of being a control deck with a combo finish. It's quite clear that players are trying to break through the Energy metagame. It isn't working, but I appreciate that the effort is still getting made.
Financial Implications
TMNT was the first Prerelease that my Local Game Store didn't sell out of since Assassin's Creed. Barely sold a third of the total kits they'd ordered and none of the events had more than 30 players. From what I've heard, this was a common experience. These Universe Beyond sets just aren't well designed. Couple that with increasing player and wallet fatigue and I don't think there's much market here.
On the other hand, I'm now hearing that Final Fantasy has just had its final printing. It was just that popular, and fair enough, it was well designed. Except for Vivi Ornitier. This means that there's finally printer space for a second run of Edge of Eternities, which my LGS is very thankful for.
The availability of a lot of sets is finally going to increase, which will have an indeterminate effect on card prices. Greater supply should lower prices, but greater availability might stimulate a rise in demand. We'll have to see.
With Standard RCQ season ending, now would normally be the time to buy up staples for the next season. I'd advise holding off for a while. Wait for the market to absorb the new print runs before buying. Most card prices will see a decrease as demand falls and availability rises, but some might actually increase. Modern prices are rising, so hopefully you stocked up before now.
