
Are you a Quiet Speculation member?
If not, now is a perfect time to join up! Our powerful tools, breaking-news analysis, and exclusive Discord channel will make sure you stay up to date and ahead of the curve.
Welcome back, readers!
This article is one I've been planning for some time. It will cover the important concept of liquidity as it relates to Magic sales.
I run across a lot of store owners with an improper understanding of the value of liquidity. As a trader or store owner you obviously love to have cards that are in constant demand. But how do we actually define that value?
Defining Liquidity
The best way to view liquidity is to look at it like compounding interest.
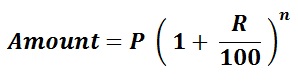
In this equation,
- Amount = amount of money after sales (future value)
- P = amount paid for the card (present value)
- R = profit percentage (the amount of profit you make per transaction)
- n = number of transactions
Where liquidity comes into play is in regards to the n variable. More liquid items have a higher probability of selling, which means you can complete more transactions over a given time frame.
Let's see if we can modify the equation to better capture this aspect. We'll substitute the n variable with an equation that represents selling turnaround time.
This will obviously vary by store, and may be hard to pin down. To calculate it, you'll have to monitor what cards move the most at your store and track the average time it takes them to move once they come it.
It also might vary by format or even individual card. For example, you might expect Standard staples to move after two weeks, but Modern staples could move a bit slower, perhaps once per month.
As a result, it's important to normalize all the sell times to the same unit, in order for any comparisons to be meaningful. For the examples below, I'll be measuring turnaround time in transactions per month.
So our additional variables are:
- x = idealized turnaround time
- y = normalized turnaround time
- n = x / y
Of course, turnaround time will correspond to your profit percentage and/or pricing strategy. Lower spreads will lead to faster moving merchandise. As we'll see farther down, you can tweak these numbers to try to arrive at the most profitable configuration for your store.
Applying the Equation
Let's illustrate this equation with some real life examples.
Foil Ruinous Path currently sells for $6.67 (TCG Mid), whereas Dragonmaster Outcast sells for $6.51. If you were to buy these from local players using a standard 50% cash option, you'd pay about the same on each ($3.25 - $3.30).
However, these cards are not equally likely to move. Outcast appears in multiples in Jeskai Black, one of the pillars of Standard, while Ruinous Path is relegated to a one-of (if that) in the sideboard of less popular decks.
If we expect Dragonmaster Outcast to move every two weeks and Ruinous Path to move once a month, we can run the numbers and see what our profit would be. For this example, we'll assume you sell at TCG Mid and buy at 50% of that, for a constant profit percentage of 100%.
Dragonmaster Outcast
Amount = $3.25 (1 + 100 / 100) ^ (2 / 1) = $13 in a one-month period
Foil Ruinous Path
Amount = $3.30 (1 + 100 / 100) ^ (1 / 1) = $6.60 in a one-month period
This is a pretty simple example, but it illustrates how liquidity can affect the money you make over a given period.
Note that Amount isn't equivalent to profit, but the value of the cards when you sell them. To get profit, you have to subtract what you paid for each card. Assuming values remained stable over the month, your profit on Dragonmaster Outcast is $13 - (2 * 3.25) = $6.5, whereas your profit from Foil Ruinous Path is $6.60 - $3.30 = $3.30.
This example is obvious, of course--I sold one card twice and the other card only once. The reason I wanted to show the equation this way, instead of something simpler, like profit = (sales price - cost) * number sold, is to highlight the profit percentage variable, R.
This allows us to tweak the variables to see what configuration leads to maximum profit. There isn't a perfect equation to do this, so we'll have to tinker with the data and try different things.
Let's say Jack and Diane own an LGS with a vibrant Standard player base. They've noticed that Deathmist Raptors are in extremely high demand. Every week they buy and sell four copies (for this example we'll use the current TCG Mid price of $22.33).
They expect demand to remain just as strong moving forward. They have a few options.
- Change nothing and enjoy the same profits they're currently reaping.
- Increase the buy price. This will reduce profit percentage (R) and increase the number of copies (n) they can sell.
- Increase the sell price. This will increase R but may reduce n.
- Decrease the sell price. This will reduce R and increase n, assuming they have extras in stock that aren't currently moving.
- Decrease the buy price. This will increase R, but likely reduce n, as they'll get fewer copies in stock.
That's a lot of choices. To determine the right one, we'll need to gather more data. Thankfully, this is a hypothetical example, and Jack and Diane have done just that.
- They increased their buy price from 50% to 60% and got an additional 2 copies in per week.
- They increased their sell price from 100% TCG Mid to 110% TCG Mid and sold 1 fewer copy per week.
- They decreased their sell price from 100% TCG Mid to 90% TCG Mid and sold 2 additional copies per week.
- They decreased their buy price from 50% to 40% and lost an additional 2 copies per week.
Let's throw those numbers into our equation and see what the results are. Remember that profit percentage (R) equals (sell price - buy price) / buy price.
| Option | P (Purchase Price) | Buy Price % | R | x | y | Sell Price | Amount |
| 1 | 13.398 | 60.00% | 66.67% | 6 | 1 | $22.33 | 13.94 |
| 2 | 11.165 | 50.00% | 120.00% | 3 | 1 | $24.56 | 11.57 |
| 3 | 11.165 | 50.00% | 80.00% | 6 | 1 | $20.09 | 11.71 |
| 4 | 8.932 | 40.00% | 150.00% | 2 | 1 | $22.33 | 9.20 |
Since we've normalized the time frame on each option, we can compare different amounts knowing they are valued at a 1:1 ratio. Judging by the numbers, Jack and Diane's best option is to increase their buy price to increase the number of transactions.
The other important thing to keep in mind is that the profit margin shifts differently depending whether you pay 10% more or reduce the cost by 10%.
~
One major takeaway from this experiment is to emphasize that you can make more money by reducing your profit margin, if it leads to more transactions.
This is how a lot of big businesses work. You'd be surprised how low the profit margin is on certain products at the dollar store, but when they sell twice as many of those products because they're at a discount, they generate more total revenue.
Either way, if you can gather a good amount of data on your store's current sales, you can use this equation to optimize your sales.
