Are you a Quiet Speculation member?
If not, now is a perfect time to join up! Our powerful tools, breaking-news analysis, and exclusive Discord channel will make sure you stay up to date and ahead of the curve.
The RCQ season is moving along, and the data is flooding in. This has produced a complicated metagame picture. The very top of the metagame is very well defined. The rest is not. The online crew has come to very different conclusions about the metagame than the paper-playing majority. Both tier lists share most of their decks, but the placing for each is wildly different. This suggests that Modern is moving towards a kind of competitive equilibrium.
Always an Outlier
As is custom, both paper and online play have outliers, but it's not clear how many. Each test returned between one and four outliers, with no two tests exactly agreeing. I do multiple tests because statisticians don't agree on the best way to find outliers. Therefore, I need consensus on to actually identify and remove a deck as an outlier.
Therefore, since Boros Energy was the only deck that was always an outlier, it has been removed from the analysis for both the paper and online tiers. It's in its correct spot on the tier lists. Both Izzet Prowess and Green-Based Eldrazi are borderline outliers, as they were sometimes identified by various tests. The most restrictive test I know about also put online Tameshi Belcher as an outlier, but it was the only one.
May Population Metagame
To make the tier list, a given deck has to beat the overall average population for the month. The average is my estimate for how many results a given deck "should" produce in a given month. To be considered a tiered deck, it must perform better than "good enough". Every deck that posts at least the average number of results is "good enough" and makes the tier list.
Then we go one standard deviation (STdev) above average to set the limit of Tier 3 and the cutoff for Tier 2. This mathematically defines Tier 3 as those decks clustered near the average. Tier 2 goes from the cutoff to the next standard deviation. These are decks that perform well above average. Tier 1 consists of those decks at least two standard deviations above the mean result, encompassing the truly exceptional performing decks.
The MTGO data nearly exclusively comes from official Preliminary, Qualifiers, and Challenge results. Leagues are excluded, as they add analytically useless bulk data to both the population and power tiers. The paper data comes from any source I can find, with all reported events being counted.
While the MTGO events report predictable numbers, paper events can report anything from only the winner to all the results. In the latter case, if match results aren't included, I'll take as much of the Top 32 as possible. If match results are reported, I'll take winning record up to Top 32, and then any additional decks tied with 32nd place, as tiebreakers are a magic most foul and black.
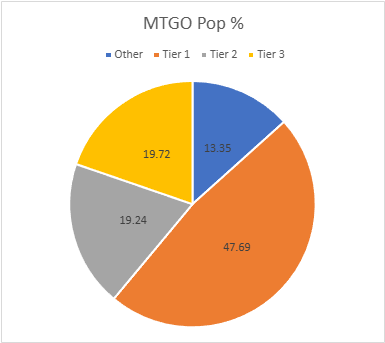
The MTGO Population Data
March's adjusted average population for MTGO is 15.75. I always round down if the decimal is less than .20. Tier 3, therefore, begins with decks posting 16 results. The adjusted STdev was 28.13, so add 28 and that means Tier 3 runs to 44 results. Again, it's the starting point to the cutoff, then the next whole number for the next Tier. Therefore Tier 2 starts with 45 results and runs to 73. Subsequently, to make Tier 1, 74 decks are required.
The sample population rose again, from 1500 in April to 1648 in May. There were a number of extra events and the Challenges appear to have no problem firing anymore. That said, I only have 84 98 unique decks in my sample, which equates to a unique deck ratio of .051, which is pretty pathetic. April's ratio was .065, so diversity is really cratering. 23 decks made the tier list, which is pretty average for Magic Online.
| Deck Name | Total # | Total % |
|---|---|---|
| Tier 1 | ||
| Boros Energy | 341 | 20.69 |
| Izzet Prowess | 162 | 9.83 |
| Green-Based Eldrazi | 126 | 7.65 |
| Tameshi Belcher | 82 | 4.98 |
| BW Blink | 75 | 4.55 |
| Tier 2 | ||
| Amulet Titan | 73 | 4.43 |
| Domain Zoo | 72 | 4.37 |
| Ruby Storm | 70 | 4.25 |
| Frogtide | 56 | 3.40 |
| Living End | 46 | 2.79 |
| Tier 3 | ||
| Broodscale Combo | 44 | 2.67 |
| Abhorrent Frogtide | 34 | 2.06 |
| Kappa | 31 | 1.88 |
| Neobrand | 29 | 1.76 |
| Mono-Black Saga | 27 | 1.64 |
| Goryo Blink | 24 | 1.46 |
| Red Belcher | 23 | 1.40 |
| Jeskai Ascendancy | 23 | 1.40 |
| Ritual Neobrand | 20 | 1.21 |
| Burn | 18 | 1.09 |
| Esper Blink | 18 | 1.09 |
| UW Control | 17 | 1.03 |
| Tribal Eldrazi | 17 | 1.03 |
There continues to be an absurd amount of Energy, but it's down from April's 22.20%. It looks like the online crew is just set in their energetic ways, and I'm starting to favor a ban just to make them play something different.
In other developments, Psychic Frog players are arguing again. Standard Frogtide is being muscled in on by Abhorrent Oculus versions. Again. Every few months the Frog players' consensus splits and the two factions compete with each other for dominance. Oculus was in fashion after it was released, but its lack of consistency meant traditional Frogtide came back. Oculus is surging again, I'm assuming because they needed a faster clock. We'll see how long it lasts this time.
The Paper Population Data
Meanwhile, Paper's population rose sharply from 795 to 1238. A lot more RCQ's reported in, and there were large events. There are a number of events that I know happened but still haven't posted results anywhere. I can't wait forever, TOs, get your results in! I recorded 100 unique decks for a ratio of .081, which is low for paper but still miles better than MTGO's diversity.
20 decks made the tier list, which is low for paper. I'm not totally surprised, however, as this is what happens in an RCQ season. Players are less likely to experiment when stakes are higher. The adjusted average population is 10.61, so 11 results make the list. The adjusted STDev is 22.45, so the increment is 23. Therefore, Tier 3 runs from 11 to 34, Tier 2 is 35 to 58 and Tier 1 is 59 and over.
| Deck Name | Total # | Total % |
|---|---|---|
| Tier 1 | ||
| Boros Energy | 187 | 15.10 |
| Izzet Prowess | 134 | 10.82 |
| Green-Based Eldrazi | 107 | 8.64 |
| Domain Zoo | 88 | 7.11 |
| Amulet titan | 81 | 6.54 |
| Tier 2 | ||
| Frogtide | 58 | 4.68 |
| BW Blink | 57 | 4.60 |
| Kappa | 47 | 3.80 |
| Jeskai Ascendancy | 40 | 3.23 |
| Broodscale Combo | 35 | 2.83 |
| Tier 3 | ||
| Tameshi Belcher | 32 | 2.58 |
| Ruby Storm | 31 | 2.50 |
| Colorless Etron | 23 | 1.86 |
| Goryo Blink | 21 | 1.70 |
| Tribal Eldrazi | 18 | 1.45 |
| Living End | 17 | 1.37 |
| Sam Ritual | 16 | 1.29 |
| Hollowvine | 13 | 1.05 |
| UW Control | 11 | 0.89 |
| Jeskai Control | 11 | 0.89 |
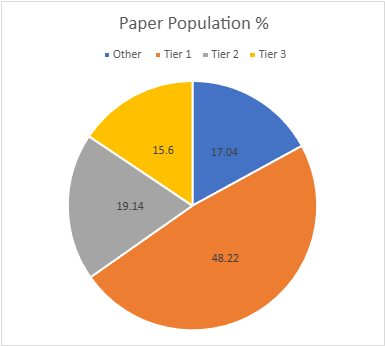
There's the same number of decks in Tier 1 and the same top 3 in the same order. However, everything else is wildly different. This strongly indicates that players agreed on the best decks in May, but the overall metagame is far less established.
Boros' metagame share rose slightly from April's 13.46%, going the opposite direction of MTGO's results. Again, this is probably just down to players being unwilling to experiment during the competitive season. There's that old saw of "if you want to win, just play the best deck" at work.
However, this also puts a huge target on their backs, and Energy's known weakness to combo is clearly being exploited. Goryo Blink is climbing the ranks after falling off hard the past few months, and Neobrand has returned (and now is several versions). This is in addition to established decks like Belcher. The lack of counterspells is at fault for this, but with Prowess and Energy running things I don't think counterspells will be viable for a while.
May Power Metagame
Tracking the metagame in terms of population is standard practice. But how do results actually factor in? Better decks should also have better results. In an effort to measure this, I use a power ranking system in addition to the prevalence list. By doing so, I measure the relative strengths of each deck within the metagame so that a deck that just squeaks into Top 32 isn't valued the same as one that Top 8's. This better reflects metagame potential.
For the MTGO data, points are awarded based on the population of the event. Preliminaries and similar events award points based on record (1 for 3 wins, 2 for 4 wins, 3 for 5), and Challenges are scored 3 points for the Top 8, 2 for Top 16, and 1 for Top 32. If I can find them, non-Wizards events will be awarded points the same as Challenges or Preliminaries depending on what the event in question reports/behaves like. Super Qualifiers and similar higher-level events get an extra point and so do other events if they’re over 200 players, with a fifth point for going over 400 players.
Due to paper reporting being inconsistent and frequently full of data gaps compared to MTGO, its points work differently. I award points based on the size of the tournament rather than placement. For events with no reported starting population or up to 32 players, one point is awarded to every deck. Events with 33 players up to 128 players get two points. From 129 players up to 512 players get three. Above 512 is four points, and five points is reserved for Modern Pro Tours. When paper reports more than the Top 8, which is rare, I take all the decks with a winning record or tied for Top 32, whichever is pertinent.
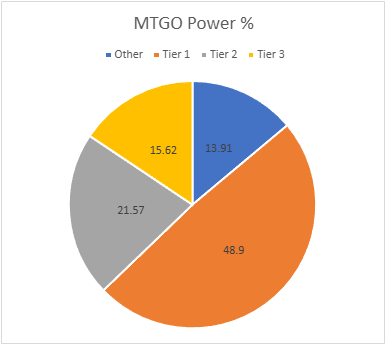
The MTGO Power Tiers
As with the population numbers, total points are up from 2612 to 2990. The adjusted average points were 28.76, therefore 29 points made Tier 3. The adjusted STDev was 53.35 so add 54 to the starting point, and Tier 3 runs to 83 points. Tier 2 starts with 84 points and runs to 138. Tier 1 requires at least 139 points. There's a lot of movement inside each tier and several decks rose and fell between Tiers. Both Burn and UW Control fell off the power
| Deck Name | Total Points | Total % |
|---|---|---|
| Tier 1 | ||
| Boros Energy | 603 | 20.17 |
| Izzet Prowess | 305 | 10.20 |
| Green-Based Eldrazi | 249 | 8.33 |
| Tameshi Belcher | 160 | 5.35 |
| Domain Zoo | 145 | 4.85 |
| Tier 2 | ||
| BW Blink | 138 | 4.61 |
| Amulet Titan | 127 | 4.25 |
| Ruby Storm | 113 | 3.78 |
| Broodscale Combo | 90 | 3.01 |
| Frogtide | 89 | 2.98 |
| Living End | 88 | 2.94 |
| Tier 3 | ||
| Abhorrent Frogtide | 68 | 2.27 |
| Kappa | 59 | 1.97 |
| Neobrand | 56 | 1.87 |
| Mono-Black Saga | 52 | 1.74 |
| Goryo Blink | 47 | 1.57 |
| Jeskai Ascendancy | 43 | 1.44 |
| Esper Blink | 42 | 1.40 |
| ritual Neobrand | 37 | 1.24 |
| Tribal Eldrazi | 35 | 1.17 |
| Red Belcher | 28 | 0.94 |
BW Blink continues to have an identity crisis, which is why it vacillates between Tiers 1 and 2 in both paper and MTGO. They can't decide if the non-Overlord of the Balemurk engine should be Recruiter of the Guard or Ketramose, the New Dawn. For those on Ketramose, there's the question of playing Psychic Frog or no, and then if you want more blue cards. I think they need to decide if they're really a Death and Taxes deck or just support for Overlord and go from there.
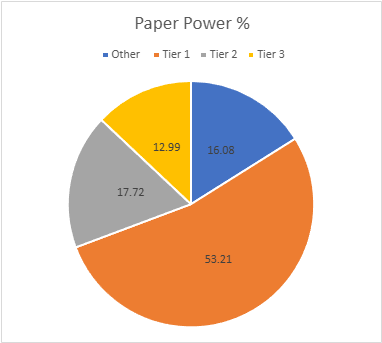
The Paper Power Tiers
Paper's total points are 2071. Again, there were a lot more RCQ's reported and more big events. The adjusted average points were 17.67, setting the cutoff at 18 points. The STDev was 37.61, so add 38 to the starting point and Tier 3 runs to 56 points. Tier 2 starts with 57 points and runs to 95. Tier 1 requires at least 96 points.
There's a lot of movement within the Tier list. Abhorrent Frogtide joined the list.
| Deck Name | Total Points | Total % |
|---|---|---|
| Tier 1 | ||
| Boros Energy | 322 | 15.55 |
| Izzet Prowess | 227 | 10.96 |
| Green-Based Eldrazi | 174 | 8.40 |
| Amulet titan | 143 | 6.90 |
| Domain Zoo | 138 | 6.66 |
| BW Blink | 98 | 4.73 |
| Tier 2 | ||
| Frogtide | 94 | 4.54 |
| Kappa | 83 | 4.01 |
| Jeskai Ascendancy | 67 | 3.23 |
| Broodscale Combo | 62 | 2.99 |
| Tameshi Belcher | 61 | 2.94 |
| Tier 3 | ||
| Ruby Storm | 54 | 2.61 |
| Colorless Etron | 33 | 1.59 |
| Goryo Blink | 33 | 1.59 |
| Tribal Eldrazi | 25 | 1.21 |
| Living End | 25 | 1.21 |
| Sam Ritual | 25 | 1.21 |
| Hollowvine | 20 | 0.97 |
| UW Control | 18 | 0.87 |
| Jeskai Control | 18 | 0.87 |
| Abhorrent Frogtide | 18 | 0.87 |
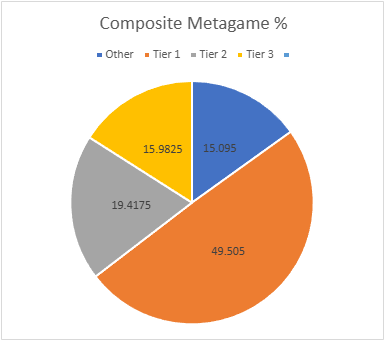
Composite Metagame
That's a lot of data, but what does it all mean? When Modern Nexus was first started, we had a statistical method to combine the MTGO and paper data, but the math of that system doesn't work without big paper events. I tried. Instead, I'm using an averaging system to combine the data. I take the MTGO results and average the tier, then separately average the paper results, then average the paper and MTGO results together for final tier placement.
This generates a lot of partial Tiers. That's not a bug, but a feature. The nuance separates the solidly Tiered decks from the more flexible ones and shows the true relative power differences between the decks. Every deck in the paper and MTGO results is on the table, and when they don't appear in a given category, they're marked N/A. This is treated as a 4 for averaging purposes.
| Deck Name | MTGO Pop Tier | MTGO Power Tier | MTGO Average Tier | Paper Pop Tier | Paper Power Tier | Paper Average Tier | Composite Tier |
|---|---|---|---|---|---|---|---|
| Boros Energy | 1 | 1 | 1 | 1 | 1 | 1 | 1.00 |
| Izzet Prowess | 1 | 1 | 1 | 1 | 1 | 1 | 1.00 |
| Green-Based Eldrazi | 1 | 1 | 1 | 1 | 1 | 1 | 1.00 |
| Domain Zoo | 2 | 1 | 1.5 | 1 | 1 | 1 | 1.25 |
| BW Blink | 1 | 2 | 1.5 | 2 | 1 | 1.5 | 1.50 |
| Amulet Titan | 2 | 2 | 2 | 1 | 1 | 1 | 1.50 |
| Tameshi Belcher | 1 | 1 | 1 | 3 | 2 | 2.5 | 1.75 |
| Frogtide | 2 | 2 | 2 | 2 | 2 | 2 | 2.00 |
| Broodscale Combo | 3 | 2 | 2.5 | 2 | 2 | 2 | 2.25 |
| Ruby Storm | 2 | 2 | 2 | 3 | 3 | 3 | 2.50 |
| Living End | 2 | 2 | 2 | 3 | 3 | 3 | 2.50 |
| Kappa | 3 | 3 | 3 | 2 | 2 | 2 | 2.50 |
| Jeskai Ascendancy | 3 | 3 | 3 | 2 | 2 | 2 | 2.50 |
| Goryo Blink | 3 | 3 | 3 | 3 | 3 | 3 | 3.00 |
| Tribal Eldrazi | 3 | 3 | 3 | 3 | 3 | 3 | 3.00 |
| UW Control | 3 | N/A | 3.5 | 3 | 3 | 3 | 3.25 |
| Abhorrent Frogtide | 3 | 3 | 3 | N/A | 3 | 3.5 | 3.25 |
| Neobrand | 3 | 3 | 3 | N/A | N/A | N/A | 3.50 |
| Mono-Black Saga | 3 | 3 | 3 | N/A | N/A | N/A | 3.50 |
| Red Belcher | 3 | 3 | 3 | N/A | N/A | N/A | 3.50 |
| Ritual Neobrand | 3 | 3 | 3 | N/A | N/A | N/A | 3.50 |
| Burn | 3 | N/A | 3.5 | N/A | N/A | N/A | 3.50 |
| Esper Blink | 3 | 3 | 3 | N/A | N/A | N/A | 3.50 |
| Colorless Etron | N/A | N/A | N/A | 3 | 3 | 3 | 3.50 |
| Sam Ritual | N/A | N/A | N/A | 3 | 3 | 3 | 3.50 |
| Hollowvine | N/A | N/A | N/A | 3 | 3 | 3 | 3.50 |
| Jeskai Control | N/A | N/A | N/A | 3 | 3 | 3 | 3.50 |
Average Power Rankings
Finally, we come to the average power rankings. These are found by taking the total points earned and dividing them by total decks, to measure points per deck. I use this to measure strength vs. popularity. Measuring deck strength is hard. There is no Wins-Above-Replacement metric for Magic, and I'm not certain that one could be credibly devised. The game is too complex, and even then, power is very contextual.
Using the power rankings helps to show how justified a deck’s popularity is. However, more popular decks will still necessarily earn a lot of points. Therefore, the top tier doesn't move much between population and power and obscures whether its decks really earned their position.
This is where the averaging comes in. Decks that earn a lot of points because they get a lot of results will do worse than decks that win more events, indicating which deck actually performs better.
A higher average indicates lots of high finishes, whereas low averages result from mediocre performances and a high population. Lower-tier decks typically do very well here, likely due to their pilots being enthusiasts. Bear this in mind and be careful about reading too much into these results. However, as a general rule, decks that place above the baseline average are over-performing, and vice versa.
How far above or below that average a deck sits justifies its position on the power tiers. Decks well above baseline are undervalued, while decks well below baseline are very popular, but aren't necessarily good.
The Real Story
When considering the average points, the key is looking at how far off a deck is from the Baseline stat (the overall average of points/population). The closer a deck’s performance to the Baseline, the more likely it is to be performing close to its "true" potential.
A deck that is exactly average would therefore perform exactly as well as expected. The greater the deviation from the average, the more a deck under or over-performs. On the low end, a deck’s placing was mainly due to population rather than power, which suggests it’s overrated. A high-scoring deck is the opposite of this.
First, the averages for MTGO:
| Deck Name | Average Points | Power Tier |
|---|---|---|
| Esper Blink | 2.33 | 3 |
| Tribal Eldrazi | 2.06 | 3 |
| Broodscale Combo | 2.04 | 2 |
| Domain Zoo | 2.01 | 1 |
| Abhorrent Frogtide | 2.00 | 3 |
| Green-Based Eldrazi | 1.98 | 1 |
| Goryo Blink | 1.96 | 3 |
| Tameshi Belcher | 1.95 | 1 |
| Neobrand | 1.93 | 3 |
| Mono-Black Saga | 1.93 | 3 |
| Living End | 1.91 | 2 |
| Kappa | 1.90 | 3 |
| Izzet Prowess | 1.88 | 1 |
| Jeskai Ascendancy | 1.87 | 3 |
| ritual Neobrand | 1.85 | 3 |
| BW Blink | 1.84 | 2 |
| Boros Energy | 1.77 | 1 |
| Amulet Titan | 1.74 | 2 |
| Baseline | 1.68 | |
| Ruby Storm | 1.61 | 2 |
| Frogtide | 1.59 | 2 |
| UW Control | 1.47 | N/A |
| Burn | 1.44 | N/A |
| Red Belcher | 1.22 | 3 |
With the best average points among Tier 1 decks, Domain Zoo wins MTGO Deck of May. Both it and Eldrazi put up really good showings whenever they showed up, particularly in the 4-point events that pushed them to the top. There's a causal link there.
Now the paper averages:
| Deck Name | Average Points | Power Tier |
|---|---|---|
| Abhorrent Murktide | 2.00 | 3 |
| Tameshi Belcher | 1.91 | 2 |
| Kappa | 1.77 | 2 |
| Broodscale Combo | 1.77 | 2 |
| Amulet titan | 1.76 | 1 |
| Ruby Storm | 1.74 | 3 |
| Boros Energy | 1.72 | 1 |
| BW Blink | 1.72 | 1 |
| Izzet Prowess | 1.69 | 1 |
| Jeskai Ascendancy | 1.67 | 2 |
| Baseline | 1.66 | |
| UW Control | 1.64 | 3 |
| Jeskai Control | 1.64 | 3 |
| Green-Based Eldrazi | 1.63 | 1 |
| Frogtide | 1.62 | 2 |
| Domain Zoo | 1.57 | 1 |
| Goryo Blink | 1.57 | 3 |
| Sam Ritual | 1.56 | 3 |
| Hollowvine | 1.54 | 3 |
| Living End | 1.47 | 3 |
| Colorless Etron | 1.43 | 3 |
| Tribal Eldrazi | 1.39 | 3 |
As is its habit, Amulet Titan wins paper's Deck of May. The Titan stans are a truly dedicated bunch.
Analysis
Modern appears to be stabilizing. It's been quite rare for paper and MTGO to agree on the top slots as cleanly as they did in June. That said, the real litmus test will be June's data. If Tier 1 continues to coalesce and harmonize then we might see the return to stability that many have clamored for. I'm not in that camp and have enjoyed the years of churn, but we will see. There's a major unexpected change to absorb.
I'll discuss it more in the financials section, but Final Fantasy doesn't look to have much impact on competitive Magic. There's not much that looks like it can compete in Standard with Monstrous Rage, Omniscience, or Nurturing Pixie. There look to be a lot of role players for Pioneer, if anyone still cares about Pioneer. For Modern, there are a lot of cards that come with many caveats. They could be work but require more work than is usually worthwhile.
The Urza's Saga... Saga
However, that doesn't matter because Final Fantasy is still one of the most impactful Standard-legal sets ever thanks to an accompanying rule change.
As of the set release, Sagas aren't sacrificed for having more lore counters than chapter abilities.
This is relevant because it means that Spreading Seas and Blood Moon don't kill Urza's Saga anymore. It'll just stick around with any abilities it had because type-changing doesn't remove granted abilities and will do so indefinitely because it can't reach Chapter 3 and be sacrificed.
Wizards did this because they wanted FF's saga-creatures to be more playable and not get sacrificed to Tishana's Tidebinder. It's not going to work for the above-mentioned reasons, but it will heavily impact all formats where Saga's legal.
Infuriatingly, it appears Wizards didn't even think about Urza's Saga while making this rule change.
Not that Saga needed help, but this is obviously a huge buff.
However, there's no way of knowing exactly how this plays out, beyond Saga seeing more play. Obviously, Amulet Titan is slightly less vulnerable to Harbinger of the Seas, but if you lose to a stream of constructs against Amulet you weren't winning anyway.
The possibility of playing Saga in decks with Harbinger or Moon is quite intriguing and I expect a flood of prison-type decks abusing this interaction. However, that may not be very good. We'll see how June plays out.
Financial Implications
Despite the huge presale numbers, I'm doubtful about FF's long-term financial outlook.
The set is pretty weak, and while the numerous legends may be popular commanders, they only need one copy. The competitive playable ones are mostly speculative. Therefore, it's likely that demand for those will be quickly sated. Due to its relatively low power and the current competitive environment, I don't foresee steady demand for product.
Additional evidence is coming from Prerelease weekend. According to both my personal Local Game Store and others in my area, FF preorders were through the roof, but many came from people they'd never seen before. Fans of the franchise came out on day one, but they bought what they wanted and left.
In most cases, they're not sticking around to play the game and therefore demand more cards.
Most Tarkir: Dragonstorm's Prereleases capped, and stores even ran out of product, but in my area only the FF Prereleases with aggressively low caps did. That's not a good sign for product demand.
Consequently, I don't think that FF sealed product is as solid an investment as it appeared when the price started spiking.
Unless there are a lot of unexpected breakout cards to drive demand back up, I don't think sealed product will appreciate past the pre-sale price in the long run. Holding sealed product has always been a risk, but FF seems to be a bigger risk than normal due to how much the pre-sale price rose. Plan accordingly.
