Are you a Quiet Speculation member?
If not, now is a perfect time to join up! Our powerful tools, breaking-news analysis, and exclusive Discord channel will make sure you stay up to date and ahead of the curve.
June represents the height of the Modern RCQ season. This means that the paper data reflects a very diverse population from a lot of different shop metagames. However, it also means that almost all the paper events were quite small and reported the Top 8 or less.
Consequently, there's a huge gap in paper's data and a massive disparity between it and Magic Online's data. Despite this, the metagame is showing signs of adaptation and evolution, which indicates an overall healthy environment.
Always the Outliers
Due to the big gap in the paper data which you'll see in that section, the outlier situation is odd. MTGO's nice and straightforward, with Boros Energy being the really obvious outlier. Honestly, I think that something from Boros should be banned just to force the online players to play something else. Paper is more complicated, and the top 5 decks were all over at least one test's line. However, the only two that they all agreed on were Energy and Domain Zoo, so those were removed.
As always, outliers are reported in their correct position on the Tier List but are removed from the data analysis.
June Population Metagame
To make the tier list, a given deck has to beat the overall average population for the month. The average is my estimate for how many results a given deck "should" produce in a given month. To be considered a tiered deck, it must perform better than "good enough". Every deck that posts at least the average number of results is "good enough" and makes the tier list.
Then we go one standard deviation (STdev) above average to set the limit of Tier 3 and the cutoff for Tier 2. This mathematically defines Tier 3 as those decks clustered near the average. Tier 2 goes from the cutoff to the next standard deviation. These are decks that perform well above average. Tier 1 consists of those decks at least two standard deviations above the mean result, encompassing the truly exceptional performing decks.
The MTGO data nearly exclusively comes from official Preliminary, Qualifiers, and Challenge results. Leagues are excluded, as they add analytically useless bulk data to both the population and power tiers. The paper data comes from any source I can find, with all reported events being counted.
While the MTGO events report predictable numbers, paper events can report anything from only the winner to all the results. In the latter case, if match results aren't included, I'll take as much of the Top 32 as possible. If match results are reported, I'll take winning record up to Top 32, and then any additional decks tied with 32nd place, as tiebreakers are a magic most foul and black.
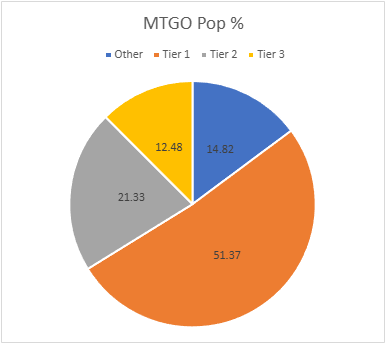
The MTGO Population Data
June's adjusted average population for MTGO is 12.10. I always round down if the decimal is less than .20. Tier 3, therefore, begins with decks posting 12 results. The adjusted STdev was 21.37, so add 22 and that means Tier 3 runs to 34 results. Again, it's the starting point to the cutoff, then the next whole number for the next Tier. Therefore Tier 2 starts with 35 results and runs to 57. Subsequently, to make Tier 1, 58 decks are required.
The sample population fell considerably, from 1648 in April to 1538 in May. There weren't any Championship or Showcase Qualifiers, just one Showcase Challenge. That said, unique decks rose to 108, which yields a unique deck ratio of .070, which is pretty good by MTGO standards considering April's ratio was .065, and May was .051. 25 decks made the tier list, which is pretty average for Magic Online.
| Deck Name | Total # | Total % |
|---|---|---|
| Tier 1 | ||
| Boros Energy | 243 | 15.80 |
| Broodscale Combo | 89 | 5.79 |
| Domain Zoo | 88 | 5.72 |
| Izzet Prowess | 80 | 5.20 |
| Tameshi Belcher | 80 | 5.20 |
| BW Blink | 74 | 4.81 |
| Amulet Titan | 71 | 4.62 |
| Green-Based Eldrazi | 65 | 4.23 |
| Tier 2 | ||
| Mardu Energy | 57 | 3.71 |
| Esper Blink | 55 | 3.58 |
| Ruby Storm | 51 | 3.32 |
| Abhorrent Frogtide | 46 | 2.99 |
| Living End | 43 | 2.80 |
| Goryo Blink | 40 | 2.60 |
| Izzet Cutter | 36 | 2.34 |
| Tier 3 | ||
| Neobrand | 30 | 1.95 |
| Grixis Wizards | 26 | 1.69 |
| Jeskai Wizards | 23 | 1.49 |
| Kappa | 21 | 1.36 |
| Frogtide | 19 | 1.23 |
| UW Control | 18 | 1.17 |
| Mono-Black Saga | 17 | 1.10 |
| Mill | 14 | 0.91 |
| Colorless Etron | 12 | 0.78 |
| Red Belcher | 12 | 0.78 |
The ongoing argument in the Psychic Frog continues as the Abhorrent Occulus version was vastly more popular in June. I therefore predict that the trend will have reversed by September. That's just how that group rolls.
Elsewhere, the Frog-having Blink players are making a run at the normal BW players. This is in the midst of BW arguing about playing Ketramose, the New Dawn over Recruiter of the Guard. As of writing this sentence, Esper has overtaken BW online. However, it is only the first week of July and a lot could change.
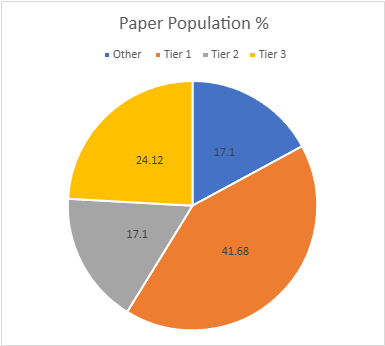
The Paper Population Data
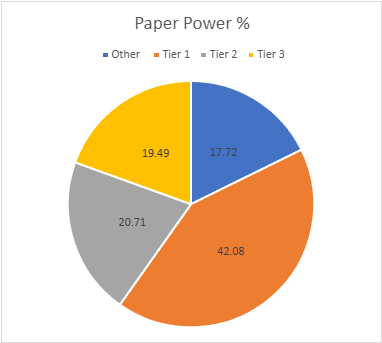
As mentioned, Paper's population fell sharply from 1238 to 655. There was only one big event (SCG Indianapolis' Super RCQ), which really hurts population numbers. It also means that that event has an oversized impact on the data, but that's only obvious on the Power Tier. I recorded 88 unique decks for a ratio of .134, which is slightly below average for paper but an improvement on the .081 it had in May.
26 decks made the tier list, which is above average for paper. The adjusted average population is 6.04, so 6 results make the list. The adjusted STDev is 9.60, so the increment is 10. Therefore, Tier 3 runs from 6 to 16, Tier 2 is 17 to 27 and Tier 1 is 28 and over.
| Deck Name | Total # | Total % |
|---|---|---|
| Tier 1 | ||
| Domain Zoo | 69 | 10.53435115 |
| Boros Energy | 66 | 10.07633588 |
| Izzet Prowess | 54 | 8.244274809 |
| Amulet Titan | 44 | 6.717557252 |
| Green-Based Eldrazi | 40 | 6.106870229 |
| Tier 2 | ||
| BW Blink | 25 | 3.816793893 |
| Esper Blink | 24 | 3.664122137 |
| Goryo Blink | 22 | 3.358778626 |
| Tameshi Belcher | 21 | 3.20610687 |
| Broodscale Combo | 20 | 3.053435115 |
| Tier 3 | ||
| Abhorrent Frogtide | 16 | 2.442748092 |
| Frogtide | 16 | 2.442748092 |
| Kappa | 14 | 2.13740458 |
| Jeskai Ascendancy | 12 | 1.832061069 |
| Tribal Eldrazi | 11 | 1.679389313 |
| Grixis Wizards | 11 | 1.679389313 |
| UW Control | 9 | 1.374045802 |
| Neobrand | 9 | 1.374045802 |
| Living End | 9 | 1.374045802 |
| Hammer Time | 8 | 1.221374046 |
| Mardu Energy | 8 | 1.221374046 |
| Izzet Cutter | 8 | 1.221374046 |
| Merfolk | 7 | 1.06870229 |
| Ruby Storm | 7 | 1.06870229 |
| Ritual Neobrand | 7 | 1.06870229 |
| Mill | 6 | 0.916030534 |
As mentioned, there's a really big gap in the data and Tier 1 is set far off from Tier 2. The decks in Tier 1 were all the most-played decks in Indianapolis, which gave them a huge boost over everything else. Domain in particular jumped out to a lead it never surrendered, though Boros made an impressive push toward the end of June. This is why the gap between Domain and Boros is so small yet the gap between them and the rest of Tier 1 is so huge.
The battles between deck variants witnessed on MTGO continued in paper, but it's much closer. This might be down to paper players being less able to switch decks, but it could also be metagame related. Paper is a far more open and therefore wilder place. It's also possible that they variants really are that close in power and choosing between them is purely personal taste.
June Power Metagame
Tracking the metagame in terms of population is standard practice. But how do results actually factor in? Better decks should also have better results. In an effort to measure this, I use a power ranking system in addition to the prevalence list. By doing so, I measure the relative strengths of each deck within the metagame so that a deck that just squeaks into Top 32 isn't valued the same as one that Top 8's. This better reflects metagame potential.
For the MTGO data, points are awarded based on the population of the event. Preliminaries and similar events award points based on record (1 for 3 wins, 2 for 4 wins, 3 for 5), and Challenges are scored 3 points for the Top 8, 2 for Top 16, and 1 for Top 32. If I can find them, non-Wizards events will be awarded points the same as Challenges or Preliminaries depending on what the event in question reports/behaves like. Super Qualifiers and similar higher-level events get an extra point and so do other events if they’re over 200 players, with a fifth point for going over 400 players.
Due to paper reporting being inconsistent and frequently full of data gaps compared to MTGO, its points work differently. I award points based on the size of the tournament rather than placement. For events with no reported starting population or up to 32 players, one point is awarded to every deck. Events with 33 players up to 128 players get two points. From 129 players up to 512 players get three. Above 512 is four points, and five points is reserved for Modern Pro Tours. When paper reports more than the Top 8, which is rare, I take all the decks with a winning record or tied for Top 32, whichever is pertinent.
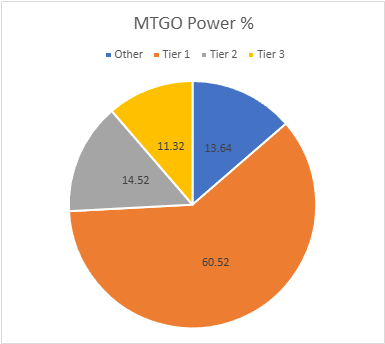
The MTGO Power Tiers
As with the population numbers, total points are down from 2990 to 2720. The adjusted average points were 21.40, therefore 22 points made Tier 3. The adjusted STDev was 39.44 so add 40 to the starting point, and Tier 3 runs to 62 points. Tier 2 starts with 63 points and runs to 103. Tier 1 requires at least 104 points. There's a lot of shuffling inside each tier and several decks rose and fell between Tiers. Colorless Etron and Red Belcher failed to make the Power Tier, but Wrenn White Blue did despite a low population. That's the specialist effect.
| Deck Name | Total Points | Total % |
|---|---|---|
| Tier 1 | ||
| Boros Energy | 430 | 15.81 |
| Domain Zoo | 164 | 6.03 |
| Broodscale Combo | 161 | 5.92 |
| BW Blink | 147 | 5.40 |
| Tameshi Belcher | 142 | 5.22 |
| Izzet Prowess | 137 | 5.04 |
| Amulet Titan | 127 | 4.67 |
| Green-Based Eldrazi | 125 | 4.59 |
| Esper Blink | 107 | 3.93 |
| Mardu Energy | 106 | 3.90 |
| Tier 2 | ||
| Abhorrent Frogtide | 89 | 3.27 |
| Living End | 86 | 3.16 |
| Ruby Storm | 79 | 2.90 |
| Goryo Blink | 79 | 2.90 |
| Izzet Cutter | 62 | 2.28 |
| Tier 3 | ||
| Neobrand | 53 | 1.95 |
| Grixis Wizards | 42 | 1.54 |
| Jeskai Wizards | 41 | 1.51 |
| Kappa | 32 | 1.18 |
| Frogtide | 32 | 1.18 |
| UW Control | 31 | 1.14 |
| Mono-Black Saga | 31 | 1.14 |
| Mill | 23 | 0.84 |
| Wrenn White Blue | 23 | 0.84 |
All the shuffling happened in Tiers 1 and 2. Tier 3 was remarkably consistent, which is unusual. Tier 3's usually the most dynamic between population to power.
Energy's overall share of the metagame is down if you count Mardu and Boros together. It's fascinating to see Mardu come back after being completely overtaken and absorbed by Boros months ago. Players are banking hard on Sephiroth, Fabled SOLDIER being really good. I understand the appeal, but the evidence that he is enough to justify the price tag isn't currently there. We'll see if that changes in July.
The Paper Power Tiers
Paper's total points are 903. Again, with only one big event and a lot of small event Top 8's points will naturally crater. The adjusted average points were 8.28, setting the cutoff at 9 points. The STDev was 13.51, so add 14 to the starting point and Tier 3 runs to 23 points. Tier 2 starts with 24 points and runs to 38. Tier 1 requires at least 39 points.
Neither Ritual Neobrand nor Mill made the cut to the power tier. They were not replaced.
| Deck Name | Total # | Total % |
|---|---|---|
| Tier 1 | ||
| Boros Energy | 99 | 10.96 |
| Domain Zoo | 92 | 10.19 |
| Izzet Prowess | 79 | 8.75 |
| Amulet Titan | 60 | 6.64 |
| Green-Based Eldrazi | 50 | 5.54 |
| Tier 2 | ||
| BW Blink | 37 | 4.10 |
| Esper Blink | 34 | 3.76 |
| Tameshi Belcher | 33 | 3.65 |
| Broodscale Combo | 30 | 3.32 |
| Goryo Blink | 28 | 3.10 |
| Abhorrent Frogtide | 25 | 2.77 |
| Tier 3 | ||
| Frogtide | 21 | 2.32 |
| Kappa | 18 | 1.99 |
| Jeskai Ascendancy | 17 | 1.88 |
| Tribal Eldrazi | 15 | 1.66 |
| UW Control | 15 | 1.66 |
| Grixis Wizards | 14 | 1.55 |
| Neobrand | 14 | 1.55 |
| Hammer Time | 12 | 1.33 |
| Living End | 11 | 1.22 |
| Merfolk | 11 | 1.22 |
| Mardu Energy | 10 | 1.11 |
| Izzet Cutter | 9 | 1.00 |
| Ruby Storm | 9 | 1.00 |
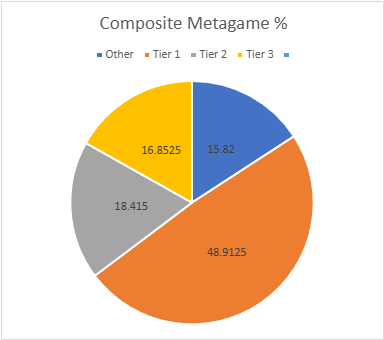
Composite Metagame
That's a lot of data, but what does it all mean? When Modern Nexus was first started, we had a statistical method to combine the MTGO and paper data, but the math of that system doesn't work without big paper events. I tried. Instead, I'm using an averaging system to combine the data. I take the MTGO results and average the tier, then separately average the paper results, then average the paper and MTGO results together for final tier placement.
This generates a lot of partial Tiers. That's not a bug, but a feature. The nuance separates the solidly Tiered decks from the more flexible ones and shows the true relative power differences between the decks. Every deck in the paper and MTGO results is on the table, and when they don't appear in a given category, they're marked N/A. This is treated as a 4 for averaging purposes.
| Deck Name | MTGO Pop Tier | MTGO Power Tier | MTGO Average Tier | Paper Pop Tier | Paper Power Tier | Paper Average Tier | Composite Tier |
|---|---|---|---|---|---|---|---|
| Boros Energy | 1 | 1 | 1 | 1 | 1 | 1 | 1.00 |
| Domain Zoo | 1 | 1 | 1 | 1 | 1 | 1 | 1.00 |
| Izzet Prowess | 1 | 1 | 1 | 1 | 1 | 1 | 1.00 |
| Amulet Titan | 1 | 1 | 1 | 1 | 1 | 1 | 1.00 |
| Green-Based Eldrazi | 1 | 1 | 1 | 1 | 1 | 1 | 1.00 |
| Broodscale Combo | 1 | 1 | 1 | 2 | 2 | 2 | 1.50 |
| Tameshi Belcher | 1 | 1 | 1 | 2 | 2 | 2 | 1.50 |
| BW Blink | 1 | 1 | 1 | 2 | 2 | 2 | 1.50 |
| Esper Blink | 2 | 1 | 1.5 | 2 | 2 | 2 | 1.75 |
| Goryo Blink | 2 | 2 | 2 | 2 | 2 | 2 | 2.00 |
| Mardu Energy | 2 | 1 | 1.5 | 3 | 3 | 3 | 2.25 |
| Abhorrent Frogtide | 2 | 2 | 2 | 3 | 2 | 2.5 | 2.25 |
| Ruby Storm | 2 | 2 | 2 | 3 | 3 | 3 | 2.50 |
| Living End | 2 | 2 | 2 | 3 | 3 | 3 | 2.50 |
| Izzet Cutter | 2 | 2 | 2 | 3 | 3 | 3 | 2.50 |
| Neobrand | 3 | 3 | 3 | 3 | 3 | 3 | 3.00 |
| Grixis Wizards | 3 | 3 | 3 | 3 | 3 | 3 | 3.00 |
| Kappa | 3 | 3 | 3 | 3 | 3 | 3 | 3.00 |
| Frogtide | 3 | 3 | 3 | 3 | 3 | 3 | 3.00 |
| UW Control | 3 | 3 | 3 | 3 | 3 | 3 | 3.00 |
| Mill | 3 | 3 | 3 | 3 | N/A | 3.5 | 3.25 |
| Merfolk | N/A | N/A | N/A | 3 | 3 | 3 | 3.50 |
| Jeskai Wizards | 3 | 3 | 3 | N/A | N/A | N/A | 3.50 |
| Mono-Black Saga | 3 | 3 | 3 | N/A | N/A | N/A | 3.50 |
| Jeskai Ascendancy | N/A | N/A | N/A | 3 | 3 | 3 | 3.50 |
| Tribal Eldrazi | N/A | N/A | N/A | 3 | 3 | 3 | 3.50 |
| Hammer Time | N/A | N/A | N/A | 3 | 3 | 3 | 3.50 |
| Colorless Etron | 3 | N/A | 3.5 | N/A | N/A | N/A | 3.75 |
| Red Belcher | 3 | N/A | 3.5 | N/A | N/A | N/A | 3.75 |
| Wrenn White Blue | N/A | 3 | 3.5 | N/A | N/A | N/A | 3.75 |
| Ritual Neobrand | N/A | N/A | N/A | 3 | N/A | 3.5 | 3.75 |
Average Power Rankings
Finally, we come to the average power rankings. These are found by taking the total points earned and dividing them by total decks, to measure points per deck. I use this to measure strength vs. popularity. Measuring deck strength is hard. While you can make a Wins-Above-Replacement-esq metric for the Magic cards in an individual deck, there's no way to make one that lets you compare decks. The game is too complex, and even then, power is very contextual.
Using the power rankings helps to show how justified a deck’s popularity is. However, more popular decks will still necessarily earn a lot of points. Therefore, the top tier doesn't move much between population and power and obscures whether its decks really earned their position.
This is where the averaging comes in. Decks that earn a lot of points because they get a lot of results will do worse than decks that win more events, indicating which deck actually performs better.
A higher average indicates lots of high finishes, whereas low averages result from mediocre performances and a high population. Lower-tier decks typically do very well here, likely due to their pilots being enthusiasts. Bear this in mind and be careful about reading too much into these results. However, as a general rule, decks that place above the baseline average are over-performing, and vice versa.
How far above or below that average a deck sits justifies its position on the power tiers. Decks well above baseline are undervalued, while decks well below baseline are very popular, but aren't necessarily good.
The Real Story
When considering the average points, the key is looking at how far off a deck is from the Baseline stat (the overall average of points/population). The closer a deck’s performance to the Baseline, the more likely it is to be performing close to its "true" potential.
A deck that is exactly average would therefore perform exactly as well as expected. The greater the deviation from the average, the more a deck under or over-performs. On the low end, a deck’s placing was mainly due to population rather than power, which suggests it’s overrated. A high-scoring deck is the opposite of this.
We'll start with MTGO's average:
| Deck Name | Average Points | Power Tier |
|---|---|---|
| Wrenn White Blue | 2.09 | 3 |
| Living End | 2.00 | 2 |
| BW Blink | 1.99 | 1 |
| Goryo Blink | 1.97 | 2 |
| Esper Blink | 1.94 | 1 |
| Abhorrent Frogtide | 1.93 | 2 |
| Green-Based Eldrazi | 1.92 | 1 |
| Domain Zoo | 1.86 | 1 |
| Mardu Energy | 1.86 | 1 |
| Mono-Black Saga | 1.82 | 3 |
| Broodscale Combo | 1.81 | 1 |
| Amulet Titan | 1.79 | 1 |
| Jeskai Wizards | 1.78 | 3 |
| Boros Energy | 1.77 | 1 |
| Tameshi Belcher | 1.77 | 1 |
| Neobrand | 1.77 | 3 |
| Izzet Cutter | 1.72 | 2 |
| UW Control | 1.72 | 3 |
| Izzet Prowess | 1.71 | 1 |
| Frogtide | 1.68 | 3 |
| Colorless Etron | 1.67 | N/A |
| Mill | 1.64 | 3 |
| Grixis Wizards | 1.61 | 3 |
| Baseline | 1.59 | |
| Ruby Storm | 1.55 | 2 |
| Kappa | 1.52 | 3 |
| Red Belcher | 1.33 | N/A |
Congratulations to MTGO Deck of June, BW Blink. You beat out every other Tier 1 deck, but I suspect beating rival Esper Blink is the greater victory. It's a pretty narrow one though.
Now for paper's average:
| Deck Name | Average Pionts | Power Tier |
|---|---|---|
| UW Control | 1.67 | 3 |
| Tameshi Belcher | 1.57 | 2 |
| Merfolk | 1.57 | 3 |
| Abhorrent Frogtide | 1.56 | 2 |
| Neobrand | 1.56 | 3 |
| Boros Energy | 1.5 | 1 |
| Broodscale Combo | 1.50 | 2 |
| Hammer Time | 1.50 | 3 |
| BW Blink | 1.48 | 2 |
| Izzet Prowess | 1.46 | 1 |
| Esper Blink | 1.42 | 2 |
| Jeskai Ascendancy | 1.42 | 3 |
| Amulet Titan | 1.36 | 1 |
| Tribal Eldrazi | 1.36 | 3 |
| Domain Zoo | 1.33 | 1 |
| Mill | 1.33 | N/A |
| Baseline | 1.32 | |
| Frogtide | 1.31 | 3 |
| Kappa | 1.29 | 3 |
| Ruby Storm | 1.29 | 3 |
| Goryo Blink | 1.27 | 2 |
| Grixis Wizards | 1.27 | 3 |
| Green-Based Eldrazi | 1.25 | 1 |
| Mardu Energy | 1.25 | 3 |
| Living End | 1.22 | 3 |
| Izzet Cutter | 1.12 | 3 |
| Ritual Neobrand | 1.00 | N/A |
Well Boros, thanks to a phenomenal showing on June 1st, you've managed to win Paper's Deck of June. Don't let it go to your head; you just barely held on at the end.
Analysis
Boros Energy's dominance is beginning to lessen. I don't think it will ever be gone without major bans or a fundamental metagame realignment, but it is slowly losing share to other decks. It's just too good at being both an aggro and midrange deck to disappear completely, but it losing ground is still a positive.
As part of that, combo decks are rising. They are Energy's worst matchup, after all. When I first predicted combo would rise back in April, I thought that it would be Belcher or Neobrand-type combos. I didn't expect Broodscale to be the top performing combo deck. When The One Ring was banned, I thought the deck was dead for good. The data agreed for a while. However, by becoming a midrange/combo hybrid the deck's made up for its weaknesses and strongly bounced back.
I don't know how long it will be able to stay there, though as it is quite targetable. If you want to absolutely crush Broodscale, White Ponza does that and is a very bad time for Boros too. What's keeping that deck from being a major force is its lack of a good value engine (you heard me, Karn, the Great Creator) and the fact that it can't beat Counterspell. It appears that Modern is moving in a fairer direction.
The Problem with Eldrazi
On that note, there are a number of decks that are unexpectedly underperforming. The first is Green-based Eldrazi, whose average points made it the worst Tier 1 deck in paper. It did pretty good on MTGO, but that is a little deceptive. The deck did really well early in June, and that strong start pulled it through despite ending June in a downward spiral.
For a deck that was thriving a few months ago, this is a significant decline. The easy answer is blaming Consign to Memory being absolutely everywhere but that was the case back then too. It'd be equally easy to blame combo being a poor matchup, but Eldrazi players are aware of their weakness and have dedicated enough sideboard slots to compensate. I don't think the overall metagame is sufficiently hostile to explain Eldrazi's struggles.
Instead, I suspect that the deck itself is the issue. There are a number of builds out there, showing that the Eldrazi players fundamentally disagree about what the deck is doing. There are the more traditional builds utilizing Ancient Stirrings and a lot of green cards to ramp and gain value, but I'm also seeing versions going heavier toward red and big colorless threats. The deck is unfocused and suffering as a consequence. I think the question of how to build Eldrazi needs to be answered before it can regain its lost ground.
Izzet Working?
Similarly, Izzet decks of all stripes aren't setting Modern on fire. I expected this to happen with Izzet Prowess. It may have a new and potent toy, but it doesn't have a new gameplan. The deck remains as weak to exile removal as it was back in 2022. Players were always going to adapt and push it back down, and this is reflected in its mediocre average points.
The more surprising one is Izzet Cutter. When Vivi Ornitier was spoiled, there was huge hype of it taking over the metagame alongside Mox Opal and Emry, Lurker of the Lock. The deck did well for a while but cratered towards the end of June. I suspected that it was too all-in on Cori-Steel Cutter and Urza's Saga as win conditions, and according to players I know, that was true. There was the additional issue of Vivi being incredibly inconsistent, being either the best or worst card in the deck with no middle-ground.
I don't think that's the end of the road for Vivi, but according to the numbers and what I'm seeing in July, this deck needs considerable reworking. This artifact deck probably isn't the best home for Vivi, as the extra mana is frequently unnecessary. It's also harder than expected to have a really big turn when you're relying as heavily on Emry as this deck is. For the sake of all those who invested in Vivi, I hope there's a turn-around soon.
Financial Implications
On that note, Final Fantasy proved financially underwhelming, as predicted. Other than Vivi and Sephiroth, there wasn't much value in the set.
However, you should immediately forget that and concentrate on buying Hardened Scales staples while they're still fairly cheap. The spoilers for Edge of Eternities are full of cards that look like Scales staples in both Modern and Pioneer. The hype machine in the Scales Discords is already getting out of control.
I don't think this is actually going to work for them. There's nothing I've seen so far that will overcome Scale's fundamental weaknesses to Solitude and Wrath of the Skies. In fact, I think the new cards encourage Scales players to slow the game down which plays into those cards even more.
Consequently, I'd buy into Scales with the intention of dumping quickly before the hype dries up. Get it cheap, let the hype raise the price, and then make a profit on the FOMO. I don't foresee the price pressure lasting too long after the Prerelease. They'll get their hearts broken quickly.
