Are you a Quiet Speculation member?
If not, now is a perfect time to join up! Our powerful tools, breaking-news analysis, and exclusive Discord channel will make sure you stay up to date and ahead of the curve.
Paper Modern was on a downswing in August as the RCQ season moves to Standard and falls off a cliff. Seriously, Wizards really should have seen this one coming.
Meanwhile, Magic Online is still having Showcase Challenges and Modern RCQs which has led to an explosion in population and points.
However, it hasn't changed the essential truth of the Modern metagame.
Expected Outliers
Boros Energy continues to be an outlier in both paper and MTGO. That can almost go without saying at this point. Energy hung with Nadu; nothing's knocking it down in the foreseeable future. Not without something worse being printed or a ban, anyway.
It is joined in outlier town on MTGO by Esper Blink. While earlier iterations relied on Psychic Frog, now it's all about Quantum Riddler. This is odd to me, as every Blink player I've asked about playing Riddler gives me a non-committal "It's...ok." I'll withhold judgement to see how it plays out.
As always, outliers are reported in their correct position on the Tier List but are removed from the data analysis.
August Population Metagame
To make the tier list, a given deck has to beat the overall average population for the month. The average is my estimate for how many results a given deck "should" produce in a given month. To be considered a tiered deck, it must perform better than "good enough". Every deck that posts at least the average number of results is "good enough" and makes the tier list.
Then we go one standard deviation (STdev) above average to set the limit of Tier 3 and the cutoff for Tier 2. This mathematically defines Tier 3 as those decks clustered near the average. Tier 2 goes from the cutoff to the next standard deviation. These are decks that perform well above average. Tier 1 consists of those decks at least two standard deviations above the mean result, encompassing the truly exceptional performing decks.
The MTGO data nearly exclusively comes from official Preliminary, Qualifiers, and Challenge results. Leagues are excluded, as they add analytically useless bulk data to both the population and power tiers. The paper data comes from any source I can find, with all reported events being counted.
While the MTGO events report predictable numbers, paper events can report anything from only the winner to all the results. In the latter case, if match results aren't included, I'll take as much of the Top 32 as possible. If match results are reported, I'll take winning record up to Top 32, and then any additional decks tied with 32nd place, as tiebreakers are a magic most foul and black.
The MTGO Population Data
August's adjusted average population for MTGO is 15.43. I always round down if the decimal is less than .20. Tier 3, therefore, begins with decks posting 16 results. The adjusted STdev was 24.85, so add 25 and that means Tier 3 runs to 41 results. Again, it's the starting point to the cutoff, then the next whole number for the next Tier. Therefore Tier 2 starts with 42 results and runs to 67. Subsequently, to make Tier 1, 68 decks are required.
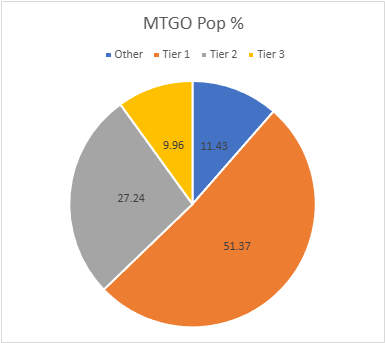
The sample population shot up from 1440 in July to 1828. As mentioned above, the Showcase Challenge and associated Last Chance Qualifiers are directly responsible for the population rise. Unique decks rose slightly, from 90 to 92. However, this means that the deck ratio fell from .062 to .050 which is really bad. The only month that's even comparable is May's .051. Diversity is hurting online. For the third month in a row, 25 decks made the tier list.
| Deck Name | Total # | Total % |
|---|---|---|
| Tier 1 | ||
| Boros Energy | 278 | 15.21 |
| Esper Blink | 161 | 8.81 |
| Domain Zoo | 103 | 5.63 |
| Grixis Reanimator | 90 | 4.92 |
| Tameshi Belcher | 89 | 4.87 |
| Amulet Titan | 80 | 4.38 |
| Ruby Storm | 69 | 3.77 |
| Colorless Etron | 69 | 3.77 |
| Tier 2 | ||
| Affinity | 67 | 3.66 |
| Broodscale Combo | 63 | 3.45 |
| UW Control | 58 | 3.17 |
| Goryo Blink | 58 | 3.17 |
| Izzet Prowess | 56 | 3.06 |
| Frogtide | 55 | 3.01 |
| Neobrand | 50 | 2.73 |
| BW Blink | 48 | 2.63 |
| Mono-Green Etron | 43 | 2.35 |
| Tier 3 | ||
| Living End | 34 | 1.86 |
| Green-Based Eldrazi | 33 | 1.80 |
| Simic Ritual | 25 | 1.37 |
| Kappa | 21 | 1.15 |
| Jeskai Wizards | 20 | 1.09 |
| Dimir Control | 17 | 0.93 |
| Mardu Energy | 16 | 0.87 |
| Mill | 16 | 0.87 |
Esper has clearly won the Blink war. This was the expected outcome. It's one of the few new cards to be Modern playable from Edge of Eternities, it was going to see a lot of play. However, I'm not sure of its long-term viability. I keep seeing it do well, but players don't seem that enthusiastic. Its price history is also fairly volatile, which indicates players being undecided. I doubt this battle is fully over.
Both Affinity and Kappa made the Tier List, so I have to explain the difference. Affinity's goal is to win via small creatures backed up by Kappa Cannoneer and Urza's Saga. Kappa's strategy is to win Cannoneer or Saga only. Everything else is the support system for those two cards. The easiest way to differentiate the two is that Affinity doesn't play Emry, Lurker of the Loch and Kappa does. There is also Izzet Cutter, which often plays Kappa but is primarily about Cori-Steel Cutter.
The Paper Population Data
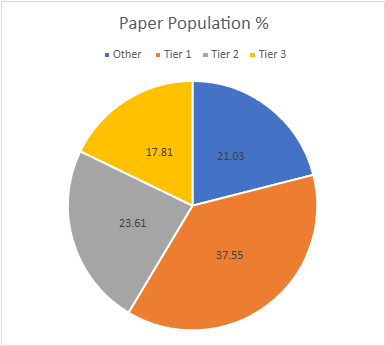
While paper's population is still depressed, a number of big events pushed its population up from 424 to 466. There were overall fewer events than in July, but the extra data from bigger events more than made up for them. I recorded 76 unique decks for a ratio of .163, a slight improvement over July's .156. MTGO's diversity is trending down while paper's is trending up. I don't think this is an accident.
22 decks made the tier list, which is close to the yearly average for paper. The adjusted average population is 5.40, so 6 results make the list. The adjusted STDev is 7.04, so the increment is 7. Therefore, Tier 3 runs from 6 to 13, Tier 2 is 14 to 21 and Tier 1 is 22 and over. This is the same as July's increment thanks to how I round.
| Deck Name | Total # | Total % |
|---|---|---|
| Tier 1 | ||
| Boros Energy | 66 | 14.16 |
| Esper Blink | 34 | 7.30 |
| Amulet Titan | 27 | 5.79 |
| Domain Zoo | 25 | 5.36 |
| Grixis Reanimator | 23 | 4.94 |
| Tier 2 | ||
| Izzet Prowess | 19 | 4.08 |
| Green-Based Eldrazi | 17 | 3.65 |
| Goryo Blink | 17 | 3.65 |
| Affinity | 15 | 3.22 |
| Broodscale Combo | 14 | 3.00 |
| Tameshi Belcher | 14 | 3.00 |
| Colorless Etron | 14 | 3.00 |
| Tier 3 | ||
| BW Blink | 13 | 2.79 |
| Izzet Cutter | 10 | 2.15 |
| Frogtide | 9 | 1.93 |
| Ruby Storm | 9 | 1.93 |
| Neoform | 8 | 1.72 |
| Simic Ritual | 7 | 1.50 |
| Mono-Green Etron | 7 | 1.50 |
| Sam Ritual | 7 | 1.50 |
| UW Control | 7 | 1.50 |
| Jeskai Dress Down | 6 | 1.29 |
Energy again ran away with paper, and by a marginally wider degree than on MTGO. This might be a function of the smaller total number of events. Let's face it, a lot of players have been playing nothing but Energy for a while now, they might not be able to play anything else. Additionally, Energy is trying out some new cards, with Haliya, Guided by Light being the most frequent addition. Haliya plays really nicely with Ocelot Pride and adds more grind into the midrange/aggro shell. I don't know why she's a 3/3 to boot.
August Power Metagame
Tracking the metagame in terms of population is standard practice. But how do results actually factor in? Better decks should also have better results. In an effort to measure this, I use a power ranking system in addition to the prevalence list. By doing so, I measure the relative strengths of each deck within the metagame so that a deck that just squeaks into Top 32 isn't valued the same as one that Top 8's. This better reflects metagame potential.
For the MTGO data, points are awarded based on the population of the event. Preliminaries and similar events award points based on record (1 for 3 wins, 2 for 4 wins, 3 for 5), and Challenges are scored 3 points for the Top 8, 2 for Top 16, and 1 for Top 32. If I can find them, non-Wizards events will be awarded points the same as Challenges or Preliminaries depending on what the event in question reports/behaves like. Super Qualifiers and similar higher-level events get an extra point and so do other events if they’re over 200 players, with a fifth point for going over 400 players.
Due to paper reporting being inconsistent and frequently full of data gaps compared to MTGO, its points work differently. I award points based on the size of the tournament rather than placement. For events with no reported starting population or up to 32 players, one point is awarded to every deck. Events with 33 players up to 128 players get two points. From 129 players up to 512 players get three. Above 512 is four points, and five points is reserved for Modern Pro Tours. When paper reports more than the Top 8, which is rare, I take all the decks with a winning record or tied for Top 32, whichever is pertinent.
The MTGO Power Tiers
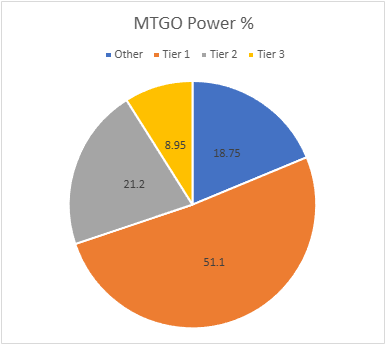
As with the population numbers, total points are down from 2552 to 3273. There was a 5-point event for the first time in a while. The adjusted average points were 27.56, therefore 28 points made Tier 3. The adjusted STDev was 45.36 so add 46 to the starting point, and Tier 3 runs to 74 points. Tier 2 starts with 75 points and runs to 121. Tier 1 requires at least 122 points. There's a lot of shuffling inside each tier but no movement between tiers. Both Mardu Energy and Mill fell off. They weren't replaced.
| Deck Name | Total Points | Total % |
|---|---|---|
| Tier 1 | ||
| Boros Energy | 492 | 15.03 |
| Esper Blink | 301 | 9.20 |
| Domain Zoo | 181 | 5.53 |
| Grixis Reanimator | 169 | 5.16 |
| Tameshi Belcher | 157 | 4.80 |
| Amulet Titan | 154 | 4.70 |
| Colorless Etron | 130 | 3.97 |
| Ruby Storm | 127 | 3.88 |
| Tier 2 | ||
| Broodscale Combo | 112 | 3.42 |
| Affinity | 107 | 3.27 |
| Goryo Blink | 107 | 3.27 |
| UW Control | 105 | 3.21 |
| Neobrand | 100 | 3.05 |
| Izzet Prowess | 95 | 2.90 |
| Frogtide | 94 | 2.87 |
| BW Blink | 84 | 2.57 |
| Mono-Green Etron | 84 | 2.57 |
| Tier 3 | ||
| Living End | 71 | 2.17 |
| Green-Based Eldrazi | 62 | 1.89 |
| Simic Ritual | 49 | 1.50 |
| Jeskai Wizards | 40 | 1.22 |
| Kappa | 39 | 1.19 |
| Dimir Control | 32 | 0.98 |
Newcomer Grixis Reanimator did incredibly well. I suspect that lack of comprehensive graveyard hate was to blame. The only answers players really needed until August were for Phlage, Titan of Nature's Fury and those aren't ideal against Reanimator. Players began adjusting and Grixis fell off toward the end of August.
The Paper Power Tiers
Paper's total points are up from 619 to 819. The adjusted average points were 9.45, setting the cutoff at 10 points. The STDev was 13.06, so add 13 to the starting point and Tier 3 runs to 23 points. Tier 2 starts with 24 points and runs to 37. Tier 1 requires at least 38 points.
Jeskai Dress Down fell off the list and was replaced by Tribal Eldrazi and Living End. I have no idea why Living End does so much worse in paper than it does online.
| Deck Name | Total # | Total % |
|---|---|---|
| Tier 1 | ||
| Boros Energy | 120 | 14.65 |
| Esper Blink | 65 | 7.94 |
| Amulet Titan | 54 | 6.59 |
| Domain Zoo | 43 | 5.25 |
| Grixis Reanimator | 40 | 4.88 |
| Tier 2 | ||
| Green-Based Eldrazi | 34 | 4.15 |
| Izzet Prowess | 28 | 3.42 |
| Tameshi Belcher | 28 | 3.42 |
| Goryo Blink | 27 | 3.30 |
| Broodscale Combo | 27 | 3.30 |
| Colorless Etron | 24 | 2.93 |
| Tier 3 | ||
| Affinity | 22 | 2.69 |
| Ruby Storm | 22 | 2.69 |
| BW Blink | 20 | 2.44 |
| Frogtide | 20 | 2.44 |
| Izzet Cutter | 16 | 1.95 |
| Neoform | 16 | 1.95 |
| Mono-Green Etron | 15 | 1.83 |
| Sam Ritual | 13 | 1.59 |
| UW Control | 13 | 1.59 |
| Simic Ritual | 11 | 1.34 |
| Tribal Eldrazi | 10 | 1.22 |
| Living End | 10 | 1.22 |

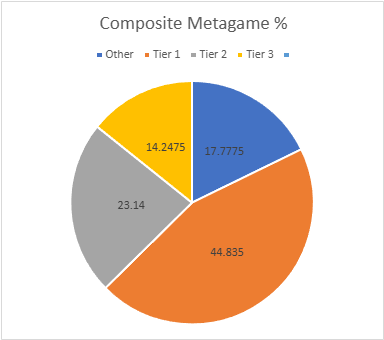
Composite Metagame
That's a lot of data, but what does it all mean? When Modern Nexus was first started, we had a statistical method to combine the MTGO and paper data, but the math of that system doesn't work without big paper events. I tried. Instead, I'm using an averaging system to combine the data. I take the MTGO results and average the tier, then separately average the paper results, then average the paper and MTGO results together for final tier placement.
This generates a lot of partial Tiers. That's not a bug, but a feature. The nuance separates the solidly Tiered decks from the more flexible ones and shows the true relative power differences between the decks. Every deck in the paper and MTGO results is on the table, and when they don't appear in a given category, they're marked N/A. This is treated as a 4 for averaging purposes.
| Deck Name | MTGO Pop Tier | MTGO Power Tier | MTGO Average Tier | Paper Pop Tier | Paper Power Tier | Paper Average Tier | Composite Tier |
|---|---|---|---|---|---|---|---|
| Boros Energy | 1 | 1 | 1 | 1 | 1 | 1 | 1.00 |
| Esper Blink | 1 | 1 | 1 | 1 | 1 | 1 | 1.00 |
| Domain Zoo | 1 | 1 | 1 | 1 | 1 | 1 | 1.00 |
| Grixis Reanimator | 1 | 1 | 1 | 1 | 1 | 1 | 1.00 |
| Amulet Titan | 1 | 1 | 1 | 1 | 1 | 1 | 1.00 |
| Tameshi Belcher | 1 | 1 | 1 | 2 | 2 | 2 | 1.50 |
| Colorless Etron | 1 | 1 | 1 | 2 | 2 | 2 | 1.50 |
| Ruby Storm | 1 | 1 | 1 | 3 | 3 | 3 | 2.00 |
| Broodscale Combo | 2 | 2 | 2 | 2 | 2 | 2 | 2.00 |
| Goryo Blink | 2 | 2 | 2 | 2 | 2 | 2 | 2.00 |
| Izzet Prowess | 2 | 2 | 2 | 2 | 2 | 2 | 2.00 |
| Affinity | 2 | 2 | 2 | 2 | 3 | 2.5 | 2.25 |
| UW Control | 2 | 2 | 2 | 3 | 3 | 3 | 2.50 |
| Frogtide | 2 | 2 | 2 | 3 | 3 | 3 | 2.50 |
| Neobrand | 2 | 2 | 2 | 3 | 3 | 3 | 2.50 |
| BW Blink | 2 | 2 | 2 | 3 | 3 | 3 | 2.50 |
| Mono-Green Etron | 2 | 2 | 2 | 3 | 3 | 3 | 2.50 |
| Green-Based Eldrazi | 3 | 3 | 3 | 2 | 2 | 2 | 2.50 |
| Simic Ritual | 3 | 3 | 3 | 3 | 3 | 3 | 3.00 |
| Living End | 3 | 3 | 3 | N/A | 3 | 3.5 | 3.25 |
| Kappa | 3 | 3 | 3 | N/A | N/A | N/A | 3.50 |
| Jeskai Wizards | 3 | 3 | 3 | N/A | N/A | N/A | 3.50 |
| Dimir Control | 3 | 3 | 3 | N/A | N/A | N/A | 3.50 |
| Izzet Cutter | N/A | N/A | N/A | 3 | 3 | 3 | 3.50 |
| Sam Ritual | N/A | N/A | N/A | 3 | 3 | 3 | 3.50 |
| Mardu Energy | 3 | N/A | 3.5 | N/A | N/A | N/A | 3.75 |
| Mill | 3 | N/A | 3.5 | N/A | N/A | N/A | 3.75 |
| Jeskai Dress Down | N/A | N/A | N/A | 3 | N/A | 3.5 | 3.75 |
| Tribal Eldrazi | N/A | N/A | N/A | N/A | 3 | 3.5 | 3.75 |
Average Power Rankings
Finally, we come to the average power rankings. These are found by taking the total points earned and dividing them by total decks, to measure points per deck. I use this to measure strength vs. popularity. Measuring deck strength is hard. While you can make a Wins-Above-Replacement-esq metric for the Magic cards in an individual deck, there's no way to make one that lets you compare decks. The game is too complex, and even then, power is very contextual.
Using the power rankings helps to show how justified a deck’s popularity is. However, more popular decks will still necessarily earn a lot of points. Therefore, the top tier doesn't move much between population and power and obscures whether its decks really earned their position.
This is where the averaging comes in. Decks that earn a lot of points because they get a lot of results will do worse than decks that win more events, indicating which deck actually performs better.
A higher average indicates lots of high finishes, whereas low averages result from mediocre performances and a high population. Lower-tier decks typically do very well here, likely due to their pilots being enthusiasts. Bear this in mind and be careful about reading too much into these results. However, as a general rule, decks that place above the baseline average are over-performing, and vice versa.
How far above or below that average a deck sits justifies its position on the power tiers. Decks well above baseline are undervalued, while decks well below baseline are very popular, but aren't necessarily good.
The Real Story
When considering the average points, the key is looking at how far off a deck is from the Baseline stat (the overall average of points/population). The closer a deck’s performance to the Baseline, the more likely it is to be performing close to its "true" potential.
A deck that is exactly average would therefore perform exactly as well as expected. The greater the deviation from the average, the more a deck under or over-performs. On the low end, a deck’s placing was mainly due to population rather than power, which suggests it’s overrated. A high-scoring deck is the opposite of this.
We'll start with MTGO's averages:
| Deck Name | Average Points | Power Tier |
|---|---|---|
| Living End | 2.09 | 3 |
| Neobrand | 2.00 | 2 |
| Jeskai Wizards | 2.00 | 3 |
| Simic Ritual | 1.96 | 3 |
| Mono-Green Etron | 1.95 | 2 |
| Amulet Titan | 1.92 | 1 |
| Grixis Reanimator | 1.88 | 1 |
| Colorless Etron | 1.88 | 1 |
| Green-Based Eldrazi | 1.88 | 3 |
| Dimir Control | 1.88 | 3 |
| Esper Blink | 1.87 | 1 |
| Kappa | 1.86 | 3 |
| Ruby Storm | 1.84 | 1 |
| Goryo Blink | 1.84 | 2 |
| UW Control | 1.81 | 2 |
| Broodscale Combo | 1.78 | 2 |
| Boros Energy | 1.77 | 1 |
| Domain Zoo | 1.76 | 1 |
| Tameshi Belcher | 1.76 | 1 |
| BW Blink | 1.75 | 2 |
| Frogtide | 1.71 | 2 |
| Izzet Prowess | 1.70 | 2 |
| Baseline | 1.63 | |
| Mill | 1.62 | N/A |
| Affinity | 1.60 | 2 |
| Mardu Energy | 1.56 | N/A |
While it's been flying under the radar recently, Amulet Titan is the MTGO Deck of August by a strong margin. That deck is very good at winning this award, but it's usually only for paper.
Now the paper averages:
| Deck Name | Average Points | Power Tier |
|---|---|---|
| Ruby Storm | 2.44 | 3 |
| Frogtide | 2.22 | 3 |
| Mono-Green Etron | 2.14 | 3 |
| Amulet Titan | 2.00 | 1 |
| Green-Based Eldrazi | 2.00 | 2 |
| Tameshi Belcher | 2.00 | 2 |
| Neoform | 2.00 | 3 |
| Tribal Eldrazi | 2.00 | 3 |
| Living End | 2.00 | 3 |
| Broodscale Combo | 1.93 | 2 |
| Esper Blink | 1.91 | 1 |
| Sam Ritual | 1.86 | 3 |
| UW Control | 1.86 | 3 |
| Boros Energy | 1.82 | 1 |
| Grixis Reanimator | 1.74 | 1 |
| Domain Zoo | 1.72 | 1 |
| Colorless Etron | 1.71 | 2 |
| Baseline | 1.66 | |
| Izzet Cutter | 1.60 | 3 |
| Goryo Blink | 1.59 | 2 |
| Simic Ritual | 1.57 | 3 |
| BW Blink | 1.54 | 3 |
| Izzet Prowess | 1.47 | 2 |
| Affinity | 1.47 | 3 |
| Jeskai Dress Down | 1.33 | N/A |
...alright, cool. Amulet Titan is Deck of August in paper, too. Funny how that happens while everyone is focused on Energy, isn't it?
Analysis
Energy's continuing dominance of Modern was expected to draw out more combo decks and for combo as a whole to expand its metagame share. Which has...kinda happened? It's very odd seeing how these decks surge and decline constantly. Last month Broodscale Combo was riding high, but it has plummeted. Somehow Ruby Storm is surging online to take its place while Titan and Belcher maintain position. Then there's Reanimator, who's status as a combo deck has always been unclear.
I have no idea Storm is taking Broodscale's place so suddenly. All I know with certainty about Broodscale's fall-off is that the creature combo guy at my LGS had a major falling out with the deck and declared it terrible a few weeks ago. This coming after months of tirelessly tuning the deck, foiling out a few versions, and playing it in every tournament he possibly could. If other Broodscalers crashed out similarly, I have to ask why now?
What's Up with Artifacts?
Artifact decks have made a comeback thanks to Pinnacle Emmisary. However, despite being popular, Affinity had terrible average points in both paper and MTGO, indicating that it is severely overplayed. While far less popular (and not even making the paper Tier List) Kappa had higher average points, significantly so online. This begs the linked questions of "why?" and "what's wrong?"
It is simplistic to blame Wrath of the Skies and call it a day. It's entirely wrong; artifact strategies would be significantly stronger if it didn't exist. Possibly even dangerously so. I'm not sorry that one card is keeping artifacts down. However, Kappa and Affinity are equally vulnerable to Wrath, so that's an insufficient explanation, especially since maindeck Wrath isn't that common these days. Even sideboard Wraths have been declining.
I think it comes back to an issue old-school Affinity had. For the fetus' who never encountered pre-2020 Ravager Affinity, the deck worked by playing tons of free artifacts to empower Mox Opal and a select number of payoffs. Affinity won by dumping its hand one turn one, playing one of its payoffs, and winning before the opponent could react. However, if it didn't hit a payoff or it was answered, all that remained was air. The current Affinity lists are similar, while Kappa has more grind thanks to Emry. For the moment, Kappa seems to be the better strategy, but we'll see how things develop.
Financial Implications
The incoming Spiderman set looks to be fairly underwhelming for Modern. It will be irrelevant for Standard so long as Vivi Cauldron remains legal. I can't recommend much from this set financially. This was designed as an Assassin's Creed type small-set, but Creed's failure meant that Spiderman was expanded into a full set at the last minute and it shows. It's just... lackluster.
There's always the chance for strong sealed product speculation, and don't count out Spiderman superfans, but my LGS contacts suggest that Preorders aren't that strong this time.
That said, there may be opportunity to for profit. Spider-Punk is notable entirely thanks to his "spells and abilities can't be countered" ability, and there's a lot of chatter from combo players about him.
Xantid Swarm isn't Modern-legal, but it used to be a significant card in Legacy. Spider-Punk is the closest Modern has to that, and that's given combo-players generally and Storm-players specifically hope. Thus, there's likely to be increased demand for combo staples, especially the money cards in Storm.
