Are you a Quiet Speculation member?
If not, now is a perfect time to join up! Our powerful tools, breaking-news analysis, and exclusive Discord channel will make sure you stay up to date and ahead of the curve.
Welcome back, readers!
Today's article will continue my series on forming a strong foundation in investing principles. For those interested, the previous articles covered the subjects of Cost, Value and Risk.
Today's subject is tied together with value---it is the other side of the same coin.
"Price is what you pay. Value is what you get."
-Warren Buffet
While the term value is harder to define, price seems obvious. The amount of money I have to pay to purchase said item. Simple enough, right? Except how is that number determined?
In a market system, price is determined by sellers putting up the items they want to sell and buyers purchasing the items they want. The more of the same item that is available, the closer to the "real price" we get.
The real price of a good or service is the point of intersection between the sell price (set by the seller whose goal is to maximize their price) and the ideal purchase price by the buyer (whose goal is to buy the item at the cheapest price possible). This is most commonly referred to as supply and demand.
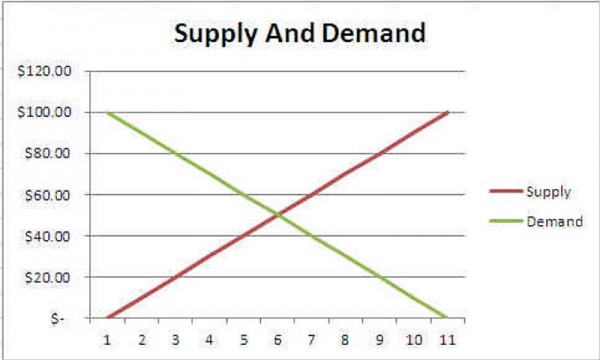
As you can see, there is an intersection point where the two curves meet, which corresponds to the ideal real market price. But how do we build this graph?
Plotting the Demand
It's not so hard to plot the demand side of it. If you have a lot of sales data you simply plot the number of cards sold at each price (it may not be exactly linear).
For a good example, let's review the sales data of Gideon, Ally of Zendikar from eBay. First I gathered 25 sales (all completed in the five days leading up to July 4th---since Standard metagames change rapidly I didn't want to include data much further back). Since these are actual sales, they best represent the demand side of things.
| Qty | Price | Shipping | Total Price per Card |
| 1 | $16.00 | $0.00 | $16.00 |
| 1 | $15.00 | $2.45 | $17.45 |
| 2 | $35.00 | $0.00 | $17.50 |
| 4 | $71.00 | $0.00 | $17.75 |
| 1 | $15.50 | $2.45 | $17.95 |
| 1 | $15.50 | $2.45 | $17.95 |
| 1 | $17.99 | $0.00 | $17.99 |
| 1 | $18.00 | $0.00 | $18.00 |
| 1 | $18.00 | $0.00 | $18.00 |
| 4 | $72.17 | $0.00 | $18.04 |
| 4 | $73.05 | $0.00 | $18.26 |
| 1 | $15.53 | $2.75 | $18.28 |
| 1 | $15.95 | $2.45 | $18.40 |
| 1 | $18.50 | $0.00 | $18.50 |
| 1 | $18.75 | $0.00 | $18.75 |
| 1 | $18.75 | $0.00 | $18.75 |
| 1 | $19.00 | $0.00 | $19.00 |
| 1 | $19.00 | $0.00 | $19.00 |
| 2 | $36.00 | $2.45 | $19.23 |
| 4 | $79.95 | $0.00 | $19.99 |
| 1 | $19.99 | $0.00 | $19.99 |
| 1 | $19.99 | $0.00 | $19.99 |
| 1 | $20.00 | $0.00 | $20.00 |
| 1 | $17.98 | $2.65 | $20.63 |
| 1 | $19.95 | $3.00 | $22.95 |
I've got the sales listed in ascending order (not date of completion). For those who remember your childhood math classes, let's look at the mean, median, and mode here.
- The mean is the average, which is $18.73.
- The mode (number that occurs the most often) is $19.99.
- The median (the number in the center of the sorted list) is $18.04.
Plotting the Supply
Now if we look at TCG Player we see the mid price (which is calculated as an average after eliminating some percent of outliers) is currently $22. Unsold product represents the supply side. These are all cards that are currently available for purchase, but which haven't found a buyer yet.
To plot the supply curve, we'll look at the individual TCG Player prices. We'll only look at NM/LP for the sake of this evaluation because we all know that condition has an effect on price (and usually a large one).
| Qty | Price | Shipping | Total Price per Card |
| 1 | $17.68 | $0.99 | $18.67 |
| 1 | $18.68 | $0.00 | $18.68 |
| 2 | $18.75 | $0.00 | $18.75 |
| 1 | $18.93 | $1.00 | $19.93 |
| 1 | $17.44 | $1.49 | $18.93 |
| 2 | $17.94 | $0.99 | $18.44 |
| 2 | $18.00 | $0.99 | $18.50 |
| 1 | $18.00 | $1.00 | $19.00 |
| 2 | $19.49 | $2.00 | $20.49 |
| 1 | $19.59 | $0.00 | $19.59 |
| 1 | $17.00 | $2.99 | $19.99 |
| 2 | $19.00 | $0.99 | $19.50 |
| 1 | $20.00 | $0.00 | $20.00 |
| 1 | $17.16 | $2.99 | $20.15 |
| 2 | $19.84 | $0.35 | $20.02 |
| 1 | $18.00 | $2.29 | $20.29 |
| 1 | $19.39 | $0.99 | $20.38 |
| 1 | $19.93 | $0.50 | $20.43 |
| 1 | $20.46 | $0.00 | $20.46 |
| 1 | $18.59 | $1.99 | $20.58 |
| 1 | $19.61 | $0.98 | $20.59 |
| 2 | $20.73 | $0.00 | $20.73 |
| 1 | $20.73 | $0.00 | $20.73 |
| 1 | $19.83 | $0.99 | $20.82 |
Here we have a mean of $19.82; mode of $20.73; and a median of $20.00.
Putting It Together
So when we compare the eBay sold prices with the current lowest TCG Player prices we get this graph:
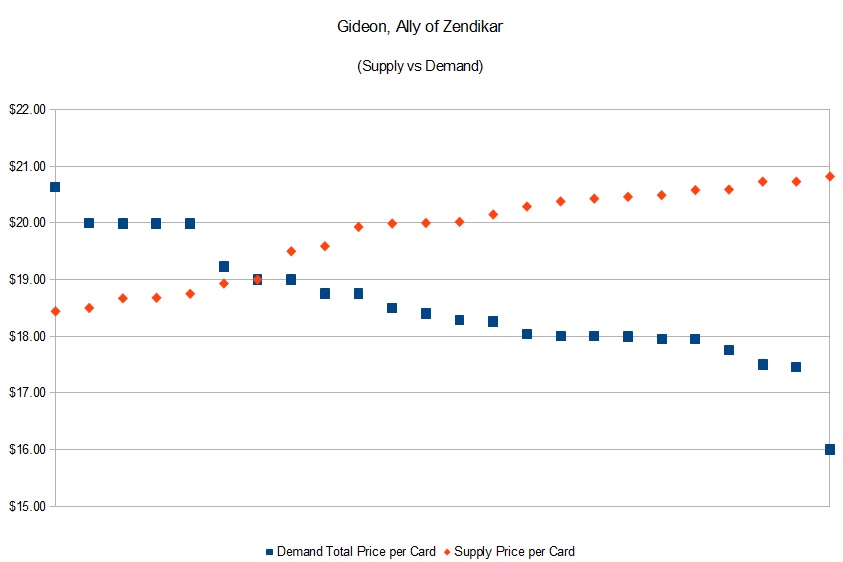
This matches our supply and demand expectations. Though as you can clearly see it's not nearly as linear as the original graph. This non-linearity is likely far more realistic.
What is interesting here is that we do in fact have cards that were available (on the supply side) for cheaper than some paid (on the demand side). This is partially a function of the buyer's "need," which we haven't addressed directly in our analysis. For example, if a player is looking for cards for FNM tonight, they may be willing to pay more.
Information discrepancies and impulse decisions can also play a part. Perhaps some buyers jumped on eBay hoping to get a lower price and got caught up in the bidding war, or were unaware of TCG Player as an option.
However, as you would expect, the demand side is below the supply side price the vast majority of the time. This also makes logical sense as most people would rather get a bargain if they can. Note that the lowest point on the supply side is still higher than over half the demand side (so if you're looking for Gideon, Ally of Zendikar, I would suggest trying your luck on eBay).
Non-Market Pricing
You may have noticed I prefaced all of this with the qualifier, "in a market system." So far humanity has yet to find a more optimal way to convert ownership of goods/services.
For those who lived under the old USSR, prices were dictated by a central authority. This authority was expected to determine what the price of a good should be by gathering data (such as cost of materials that go into making it, labor hours to make it, cost of machinery needed to make it, etc.).
The problem they faced was that prices for different goods are often linked together. For example, if it's your job to figure out the cost of shoes, you could gather all your data and decide that $20 a pair is a good price. Now, say I'm the guy who is supposed to determine the price of leather jackets. If the demand for shoes goes up because your price is too low, the demand for the material for leather jackets may go up as well. But if I assigned my price a week before yours, it may no longer be anywhere near the true price (because the cost of materials has just gone up).
I bring it up because with all the buyouts currently we have people who are similarly assigning a new price to cards they themselves bought out. This is a free society and they are welcome to do as they please (regardless of anyone's opinion on the matter). But they do so with no information regarding the market demand, which has likely dropped due to this artificial price spike.
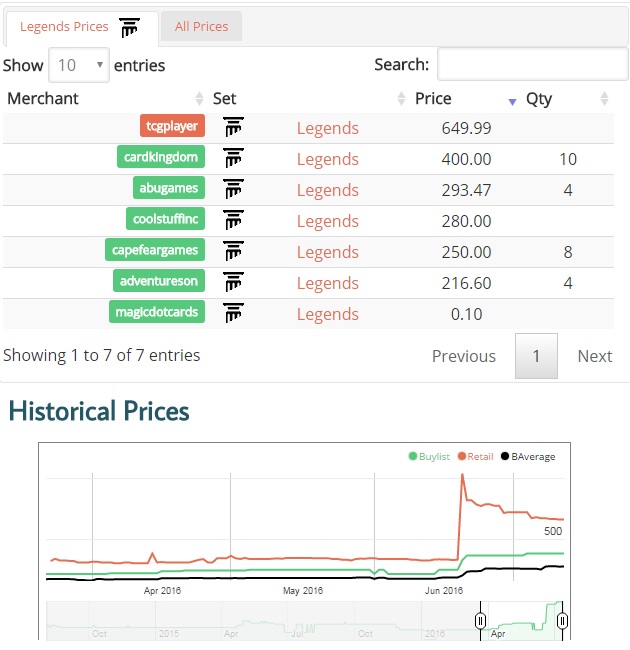
They are in fact gambling on the thought that the market demand will remain close to the same that it was pre-spike (but it almost assuredly will not). So now they are stuck holding cards they have priced (artificially) and hoping demand catches up. For those interested, here is the price graph for Moat.
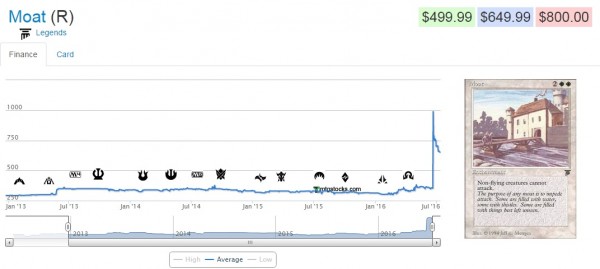
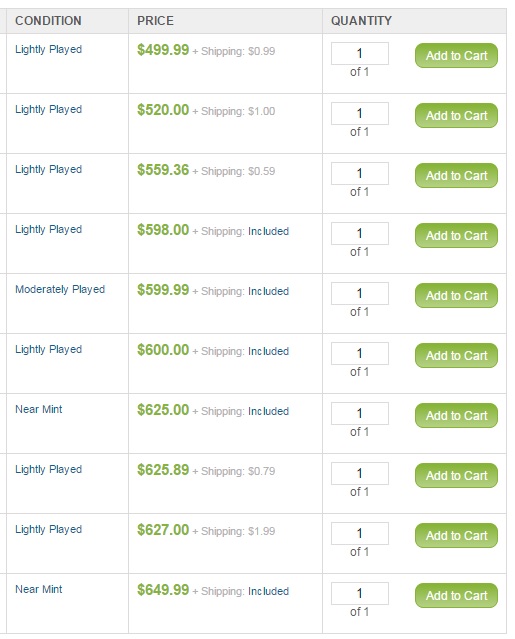
The buyout occurred on June 19th, 2016. Here are the current listings on TCG Player (supply side):
And here are the purchases on eBay since the spike (demand side):
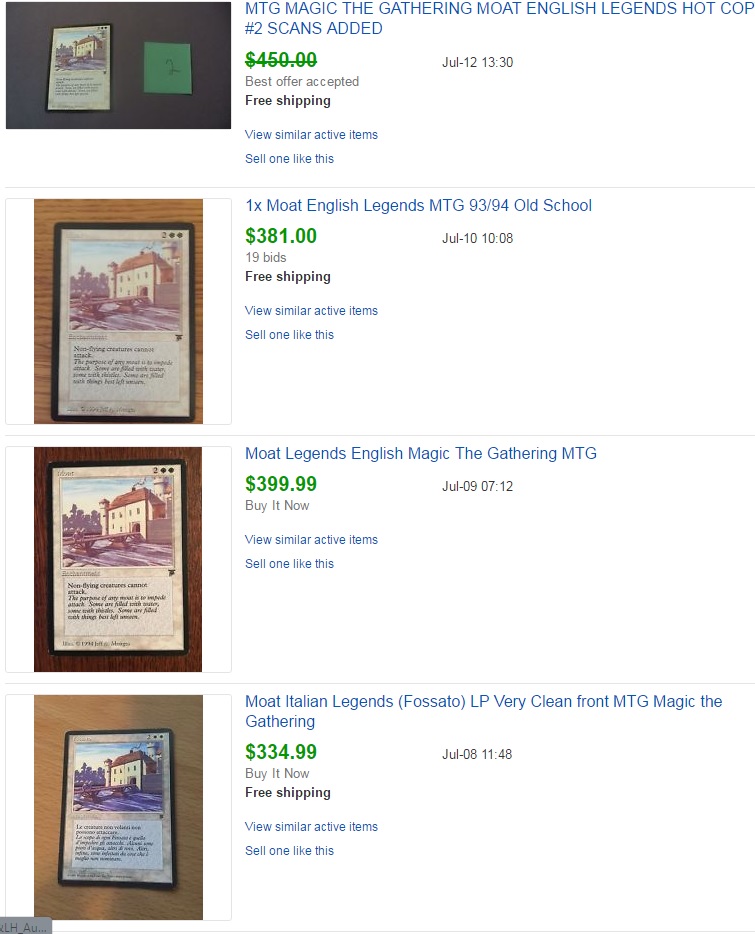
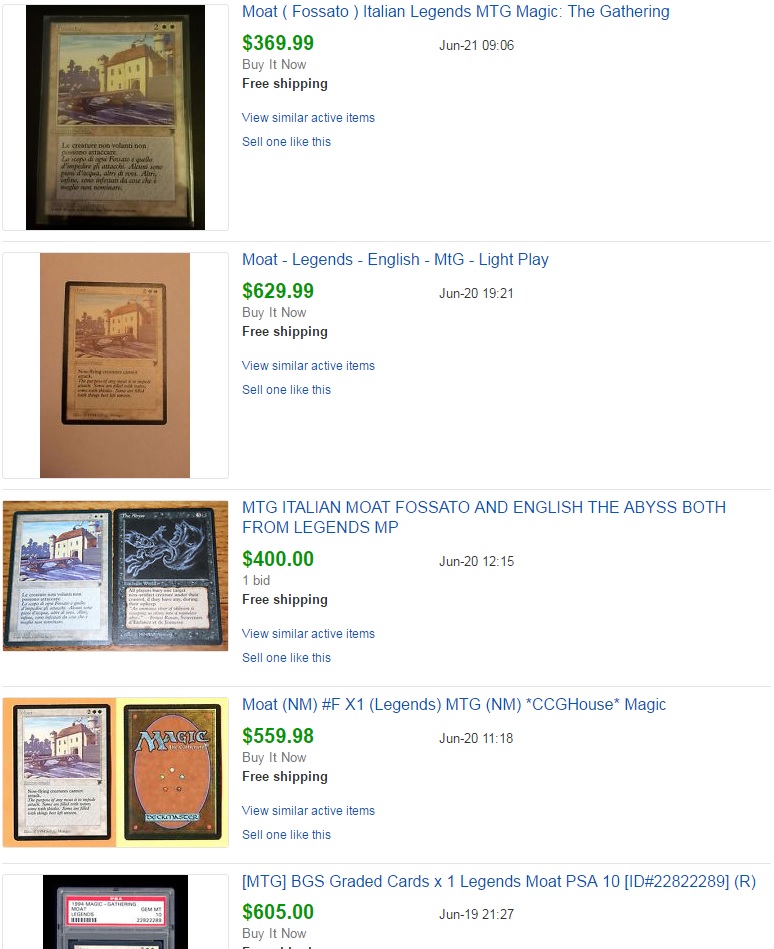
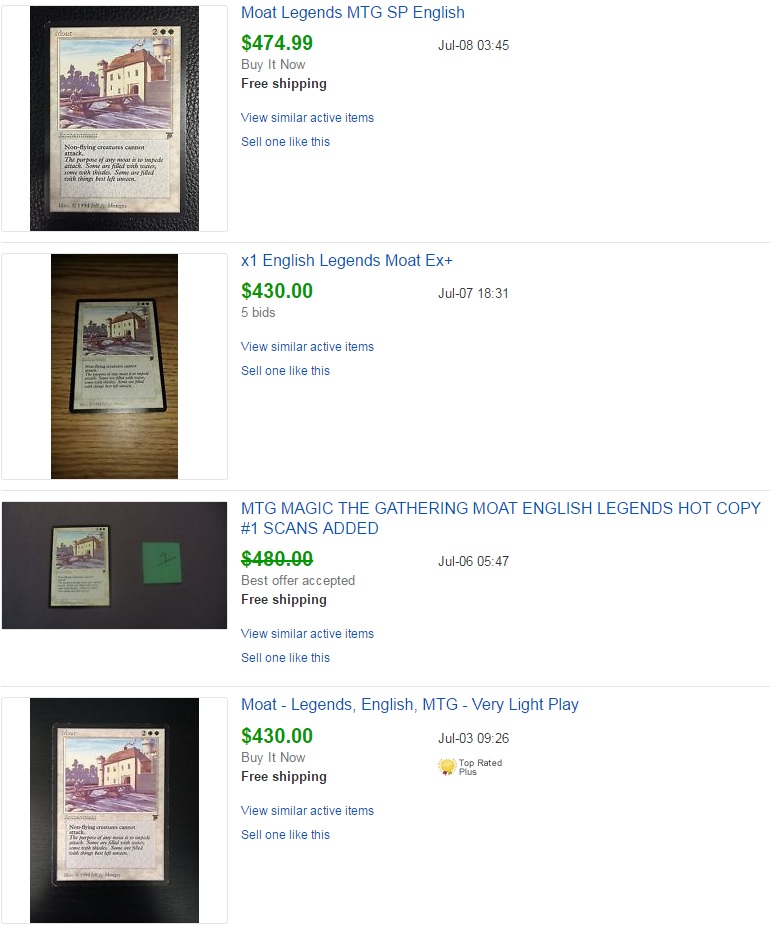
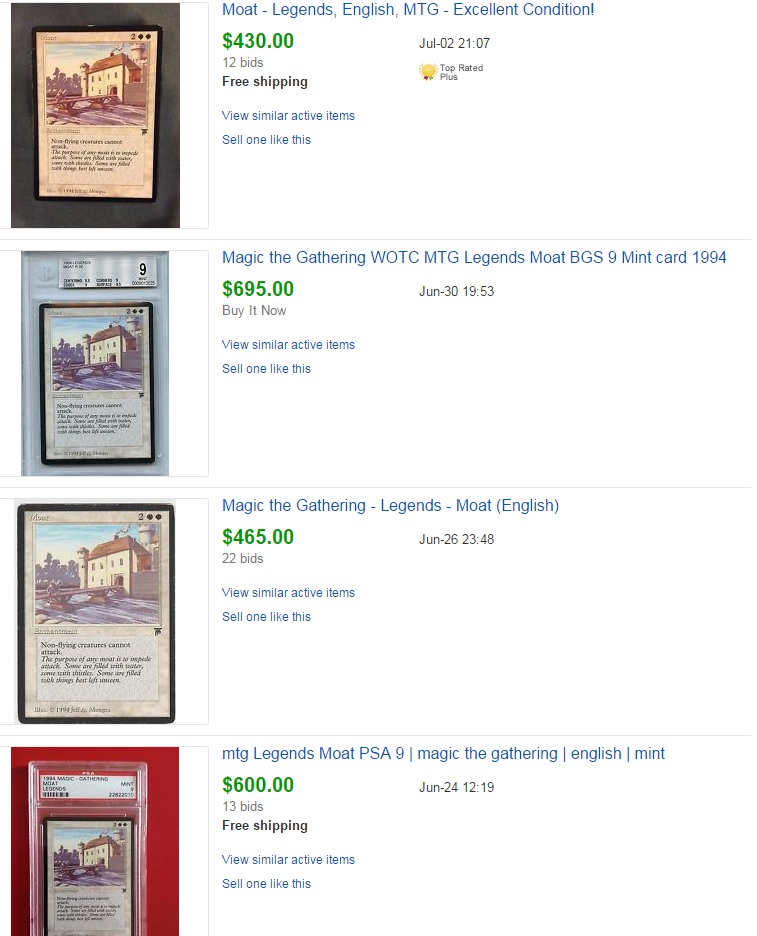
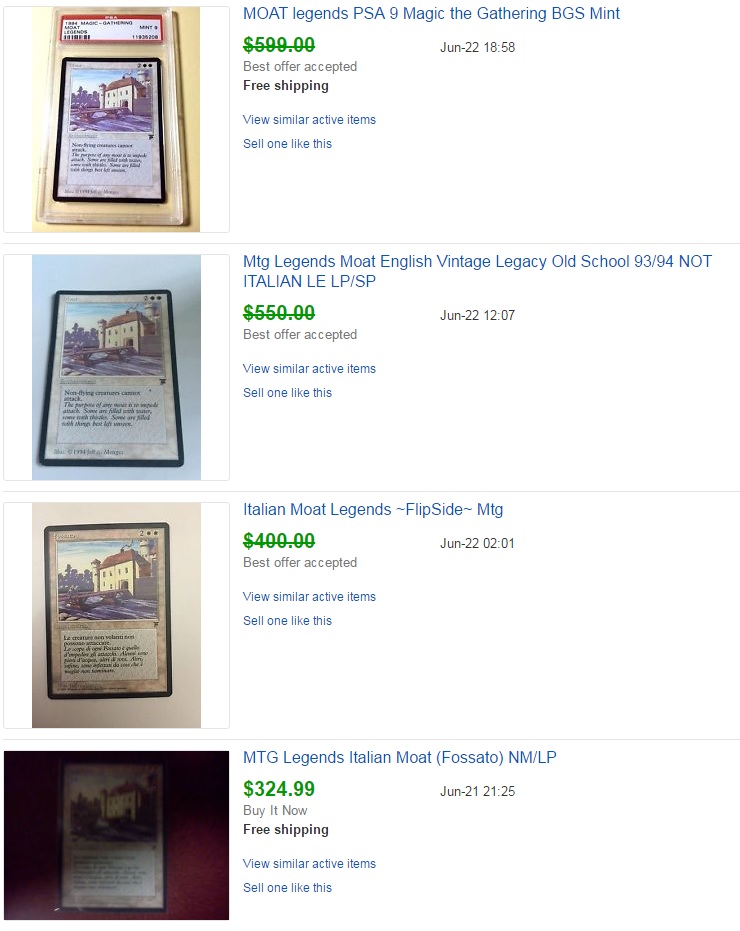
We should ignore any of the graded copies, as the grading adds additional value and these prices likely haven't changed much anyway. What we see first and foremost is the highest eBay purchase prices were right after the spike. The further you get from June 19th, the lower the actual price goes.
In fact, the three most recent purchases (of which we know the specific price paid) isn't that far off what Moat was going for pre-spike. The implication is that the price is unlikely to stick, given that it's only taken about three weeks for the card to return to within 15% of the original pricing.
You can also check out the buylist spreads on these spikes and notice that they've gone up dramatically from before (compare the size of the gap between the orange and green lines in the graph below).
Hopefully this serves as fair warning to those trying to manipulate the market. While it may not be too difficult to buy up all the copies of certain cards (if you have a decent-sized bankroll), artificially inflating the price easily pulls you away from the actual market demand---and you don't make any profit until you actually sell the cards.

@David – Love these foundation pieces, and very glad you touched on the buyouts. I’m shocked that so much public commentary has assumed these spike prices “reset” the market price, which simply is not the case.
Great work!
Thanks. We have so many good writers that focus on specific cards, I like the idea of the site having a “macro” level view of it as well. I was honestly surprised when I did the ebay research regarding the most recent moat sales and found that the ones that are actually selling…aren’t that much higher than they used to be.