Are you a Quiet Speculation member?
If not, now is a perfect time to join up! Our powerful tools, breaking-news analysis, and exclusive Discord channel will make sure you stay up to date and ahead of the curve.
It's time to wrap up 2021. For real this time. Sorry to disappoint anyone, but I can't fully close the books on last year until I have fully unloaded the books about the year. Which is my way of saying that I have an entire year's worth of data accumulated, and now it's time to display and explain it. Today then, I bring you the full metagame for post-ban 2021 Modern.
I feel the need to lead with a confession. It didn't occur to me to combine the data for the full year last year. So I didn't. Thankfully, comments coming in around August put it back on my radar. Because I didn't plan this out, I didn't worry about full deck-name consistency month to month. If a deck didn't consistently show up on the Tier list, there wasn't much need to worry about what it was called. This created considerable headaches once I combined the data because I reused a lot of names for decks that changed considerably over the year. I'll be better about watching for that next time.
Methodology
This both is and is not a typical metagame article. It is just like any other metagame article I've done over the past 18 months because all I'm doing is aggregating the data I've previously reported. I literally just added each month's total data together to generate the total data for the year. Mechanically, everything is the same as it is for a normal monthly metagame update.
What is very different is the scope of this analysis. Specifically, a normal update is for one month, while this one comprises ten. I did not include the data for January because it represented a metagame that was banned away, and I didn't bother doing an update for February for the same reason. That means that decks that have disappeared from the current metagame are not only present but have a strong impact on the data.
It also means that there are a ton of singleton decks, which significantly alters the data. The standard deviation (STDev) is extremely high thanks partially to time pressures, but also to the vast distance from the bottom to the top. In short, the number of decks making the tier list is high, but at the same time, every outlier test essentially fails. By most normal tests, every Tiered deck is an outlier. I've decided to ignore this and press ahead because it won't affect the conclusions. To any statisticians out there: I'd love to hear what you would have done!
2021 Metagame
To make the yearly tier list, a given deck has to beat the overall average population for that year. The average is my estimate for how many results a given deck “should” produce on MTGO since that's what's being sampled. Being a tiered deck requires being better than “good enough;” for 2021 the average population was 21.96 setting the Tier 3 cutoff at 22 decks. (I told you this would like the monthly updates, just with a twist.)
Tier 3 begins with decks posting 22 results. Then we go one standard deviation above average to set the limit of Tier 3 and cutoff for Tier 2. The STdev was 51.77, which means that means Tier 3 runs to 74 results. Again, it's the starting point to the cutoff, then one above for the next Tier. That's an STdev to make statistics projects worry, but it makes sense given the data set. Tier 2 starts with 75 results and runs to 127. Subsequently, to make Tier 1, 128 decks are required. Which sounds very high, but actually isn't in aggregate.
The Tier Data
Unsurprisingly, with 10 months' worth of data included, the number of decks being analyzed is staggering. Between March and December 2021, 4,811 individual results were posted, representing 220 unique decks. Mostly unique, anyway. Remember my opening confession? That applies here. Grixis Control is the worst offender. In March, that deck was a pure control deck. These days it's more like Death's Shadow-less Grixis Shadow. Recognizable as derivative, but not exactly the same deck. And those are the most similar decks; I called almost every Grixis-colored deck without Shadow "control." Therefore, its numbers are arguably inflated. This is true of a number of other decks too, but there's not much to be done about it this go-round.
Of those 220 unique decks, 41 had enough representatives to make the tier list. This is much less than I thought would make it, considering that most months put ~15 decks on the list. But the data is what it is.
| Deck Name | Total # | Total % |
|---|---|---|
| Tier 1 | ||
| Hammer Time | 421 | 8.75 |
| UR Murktide | 300 | 6.24 |
| UW Control | 234 | 4.86 |
| Burn | 221 | 4.59 |
| Cascade Crashers | 202 | 4.20 |
| Amulet Titan | 189 | 3.93 |
| Izzet Prowess | 187 | 3.89 |
| Heliod Company | 153 | 3.18 |
| Blue Living End | 136 | 2.83 |
| 4-Color Blink | 131 | 2.72 |
| Mono-Green Tron | 128 | 2.66 |
| Tier 2 | ||
| Jund Saga | 115 | 2.39 |
| Grixis Death's Shadow | 110 | 2.29 |
| Eldrazi Tron | 109 | 2.27 |
| Jund Death's Shadow | 107 | 2.22 |
| Yawgmoth | 106 | 2.20 |
| Tribal Elementals | 83 | 1.73 |
| Mill | 79 | 1.64 |
| Tier 3 | ||
| Rakdos Rock | 74 | 1.54 |
| Grixis Control | 73 | 1.52 |
| Ponza | 72 | 1.50 |
| Niv 2 Light | 62 | 1.29 |
| Dredge | 62 | 1.29 |
| Death and Taxes | 59 | 1.23 |
| Esper Control | 59 | 1.23 |
| Jund | 55 | 1.14 |
| 4-Color Bring to Light | 54 | 1.12 |
| 4-Color Creativity | 49 | 1.02 |
| Mono-Red Prowess | 42 | 0.87 |
| Boros Prowess | 41 | 0.85 |
| Humans | 39 | 0.81 |
| 4-Color Control | 35 | 0.72 |
| Belcher | 34 | 0.71 |
| Urza's Kitchen | 29 | 0.60 |
| 4-Color Omnath | 29 | 0.60 |
| Hardened Scales | 27 | 0.56 |
| Infect | 26 | 0.54 |
| Ad Nauseam | 25 | 0.52 |
| WB Stoneblade | 24 | 0.50 |
| Spirits | 23 | 0.48 |
| Izzet Through the Breach | 23 | 0.48 |
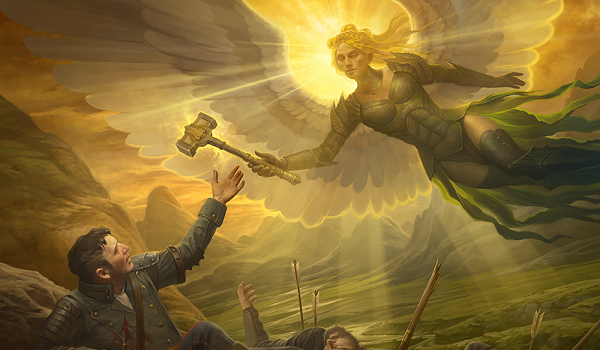
Congratulations to Hammer Time, the most successful deck of 2021 by population. And by a considerable distance. This makes perfect sense, given that it has been #1 on my charts since July and has at least made Tier 3 since March. As far as I remember, the former is the longest streak for a single deck since Splinter Twin was banned. Grixis Shadow is the only deck that comes close to that mark with a reign lasting from Summer to Fall of 2017. The latter is far less unique, lots of decks hang around month-in, month-out.
Lingering Relics
I'd like to draw attention to Izzet Prowess and Heliod Company. Neither has been a metagame force (or in Company's case, made the monthly Tier list) since Modern Horizons 2 (MH2) was released. However, their results from those three months of Tier 1 placement were enough to carry them for the entire year. Neither deck completely disappeared, and I did see them in the total data periodically. Still, it was pretty dramatic how both cratered once Solitude entered the format. Does anyone else remember the chatter around Company being too good?
Up-And-Comers
On that same note, the impact of MH2 has been quite dramatic. Neither UR Murktide nor Cascade Crasher was possible prior to the printing of Murktide Regent and Shardless Agent. However, they've firmly placed themselves in the top half of Tier 1. Living End provides a mild counterpoint. It had moved away from its Jund roots before Agent became legal, but Agent noticeably improved the deck. That's not to say that Modern has devolved into MH2 Block Constructed. Hammer Time, Burn, UW Control, and Amulet Titan were all successful decks prior to MH2. Many of the more MH2-heavy decks are low in Tier 3 (a valuable datapoint supporting the argument that Horizons sets enable lesser-played strategies).
In fact, I was quite surprised to see Burn take fourth place in Tier 1. It's spent most of the year as a Tier 3 deck, always hanging around but not making itself known. It only made Tier 1 September and October. Nonetheless, by being a presence in the metagame consistently, it amassed sufficient results to hang with the flashier decks. Cascade is in a similar position where it doesn't perform exceptionally month-to-month, but it does always perform.
Power Rankings
Tracking the metagame in terms of population is standard practice. But how do results actually factor in? Better decks should also have better results. In an effort to measure this, I use a power ranking system in addition to the prevalence list. By doing so, I measure the relative strengths of each deck within the metagame. The population method gives a deck that consistently just squeaks into Top 32 the same weight as one that Top 8’s. Using a power ranking rewards good results and moves the winningest decks to the top of the pile and better reflects its metagame potential.
Points are awarded based on the population of the event. Preliminaries award points for record (1 for 3 wins, 2 for 4 wins, 3 for 5) and Challenges are scored 3 points for Top 8, 2 for Top 16, 1 for Top 32. If I can find them, non-Wizards events will be awarded points the same as Challenges or Preliminaries are depending on what the event in question reports/behaves like. Super Qualifiers and similar higher-level events get an extra point and so do other events if they’re over 200 players, with a fifth point for going over 400 players. Which is really important for the monthly updates and utterly irrelevant for this yearly update.
The Power Tiers
Just like with the population, the point total is extremely high. The Modern metagame earned 5,592 total points in 2021, with an average of 37.79 per deck. Therefore 38 points makes Tier 3. The STDev was 90.83, which is enormous just like with population. And again, given the size and dispersion of the data it makes statistical sense. Thus add 91 to the starting point and Tier 3 runs to 129 points. Tier 2 starts with 130 points and runs to 221. Tier 1 requires at least 222 points. Which again, sounds like a lot, but as it turns out, over the course of a year really isn't.
The number of decks on the power tiers fell slightly from 41 to 39. The bottom three decks from the population tier didn't earn enough points to stay on the tier list, but there was one deck that wasn't popular enough to make the population that was surprisingly successful and made the power tier.
| Deck Name | Total Points | Total % |
|---|---|---|
| Tier 1 | ||
| Hammer Time | 730 | 13.05 |
| UR Murktide | 538 | 9.62 |
| UW Control | 403 | 7.21 |
| Burn | 374 | 6.69 |
| Cascade Crashers | 352 | 6.29 |
| Amulet Titan | 331 | 5.92 |
| Izzet Prowess | 318 | 5.69 |
| Heliod Company | 280 | 5.00 |
| Blue Living End | 251 | 4.49 |
| 4-Color Blink | 244 | 4.36 |
| Tier 2 | ||
| Mono-Green Tron | 206 | 3.68 |
| Yawgmoth | 202 | 3.61 |
| Jund Saga | 201 | 3.59 |
| Grixis Death's Shadow | 199 | 3.56 |
| Jund Death's Shadow | 198 | 3.54 |
| Eldrazi Tron | 187 | 3.34 |
| Mill | 154 | 2.75 |
| Tribal Elementals | 152 | 2.72 |
| Rakdos Rock | 134 | 2.40 |
| Tier 3 | ||
| Grixis Control | 119 | 2.13 |
| Death and Taxes | 113 | 2.02 |
| Niv 2 Light | 112 | 2.00 |
| Ponza | 110 | 1.97 |
| Dredge | 108 | 1.93 |
| Esper Control | 92 | 1.65 |
| 4-Color Bring to Light | 92 | 1.65 |
| Jund | 88 | 1.57 |
| 4-Color Creativity | 77 | 1.38 |
| Boros Prowess | 68 | 1.21 |
| Mono-Red Prowess | 67 | 1.20 |
| Belcher | 62 | 1.11 |
| Humans | 61 | 1.09 |
| 4-Color Control | 58 | 1.04 |
| Urza's Kitchen | 49 | 0.88 |
| Hardened Scales | 47 | 0.84 |
| Ad Nauseam | 45 | 0.80 |
| 4-Color Omnath | 44 | 0.79 |
| Infect | 41 | 0.73 |
| Lorehold Turns | 38 | 0.68 |
So once again, congratulations to Hammer Time for being the winningest deck by quite a margin. If you'd kindly apply everything I said about Hammer Time under the population list to the power list as well, we'll be free to move on to a new topic.
What surprises me is how stable Tier 1 is. Tron fell off into Tier 2, but the order of decks didn't change at all. In stark contrast, Tiers 2-3 are shaken up significantly. It goes to show that the best decks really are the best decks. It also shows how much mastery and enthusiasm for a deck matter in the lower tiers. The popular decks perform well for everyone and put lots of players into contention. The lower the popularity, the more individual results matter and true masters/enthusiasts will earn more points than an average player, pushing their deck higher on the power charts than in population.
Average Power Rankings
Finally, we come to the average power rankings. These are found by taking the total points earned and dividing it by total decks, which measures points per deck. I use this to measure strength vs. popularity. Measuring deck strength is hard. There is no Wins-Above-Replacement metric for Magic, and I'm not certain that one could be credibly devised. The game is too complex, and even then, power is very contextual. Using the power rankings certainly helps and serves to show how justified a deck’s popularity is. However, more popular decks will still necessarily earn a lot of points. Which tracks, but also means that the top tier doesn't move much between population and power, and obscures whether they really earned their position.
This is where the averaging comes in. Decks that earn a lot of points because they get a lot of results will do worse than decks that win more events, indicating which deck actually performs better. A higher average indicates lots of high finishes, where low averages result from mediocre performances and a high population. Lower-tier decks typically do very well here, likely due to their pilots being enthusiasts. So be careful about reading too much into the results. However, as a general rule decks which place above the baseline average are overperforming and vice versa. How far above or below that average determines how "justified" a decks position on the power tiers are. Decks well above baseline are therefore undervalued while decks well below baseline are very popular but necessarily especially good.
The Real Story
When considering the average points, the key is looking at how far-off a deck is from the Baseline stat (the overall average of points/population). The closer a deck’s performance to the Baseline, the more likely it is to be performing close to its “true” potential. A deck that is exactly average would therefore perform exactly as well as expected. The further away the greater the deviation from average, the more a deck under- or over-performs. On the low end, the deck’s placing was mainly due to population rather than power, which suggests it’s overrated. A high-scoring deck is the opposite.
| Deck Name | Average Points | Power Tier |
|---|---|---|
| Mill | 1.95 | 2 |
| Yawgmoth | 1.91 | 2 |
| Death and Taxes | 1.91 | 3 |
| 4-Color Blink | 1.86 | 1 |
| Blue Living End | 1.85 | 1 |
| Jund Death's Shadow | 1.85 | 2 |
| Heliod Company | 1.83 | 1 |
| Tribal Elementals | 1.83 | 2 |
| Belcher | 1.82 | 3 |
| Grixis Death's Shadow | 1.81 | 2 |
| Rakdos Rock | 1.81 | 2 |
| Niv 2 Light | 1.81 | 3 |
| Lorehold Turns | 1.81 | 3 |
| Ad Nauseam | 1.80 | 3 |
| UR Murktide | 1.79 | 1 |
| Amulet Titan | 1.75 | 1 |
| Jund Saga | 1.75 | 2 |
| Cascade Crashers | 1.74 | 1 |
| Dredge | 1.74 | 3 |
| Hardened Scales | 1.74 | 3 |
| Hammer Time | 1.73 | 1 |
| UW Control | 1.72 | 1 |
| Eldrazi Tron | 1.72 | 2 |
| Izzet Prowess | 1.70 | 1 |
| 4-Color Bring to Light | 1.70 | 3 |
| Burn | 1.69 | 1 |
| Urza's Kitchen | 1.69 | 3 |
| Boros Prowess | 1.66 | 3 |
| 4-Color Control | 1.66 | 3 |
| Grixis Control | 1.63 | 3 |
| Mono-Green Tron | 1.61 | 2 |
| Jund | 1.60 | 3 |
| Baseline | 1.59 | |
| Mono-Red Prowess | 1.59 | 3 |
| Infect | 1.58 | 3 |
| 4-Color Creativity | 1.57 | 3 |
| Esper Control | 1.56 | 3 |
| Humans | 1.56 | 3 |
| Ponza | 1.53 | 3 |
| 4-Color Omnath | 1.52 | 3 |
Congratulations to 4-Color Blink, the highest performing Tier 1 deck for 2021. That's amazing considering it only made the Tier list after it became a Yorion, the Sky Nomad/Omnath, Locus of Creation pile in the last few months.
The baseline stat is quite low at 1.59, as expected given the data. The number of decks with an average point of 1 is quite high, and not all of those are singleton entries. Thus, a lot of decks necessarily look like they're over-performing, when in fact they're mostly performing in line with expectations. More surprising is that no deck managed to break an average of 2 points for the whole year. There are always decks doing so in the monthly updates, but I guess the pressures of the full year preclude such a feat.
Bye for Good, 2021!
And with that done, we can safely close the books on 2021, the Year of the Hammer. Whether this honorary will apply to 2022 is yet to be seen. I'm hoping that the metagame begins to churn and new decks are able to dethrone the champs, but we shall see. There is a new set about to drop, after all.
