Are you a Quiet Speculation member?
If not, now is a perfect time to join up! Our powerful tools, breaking-news analysis, and exclusive Discord channel will make sure you stay up to date and ahead of the curve.
Welcome to the End Times! Otherwise known as December. 2021 is drawing to a close. While not as abjectly awful as 2020 was, it was still far from a year to remember fondly. At least it's almost over and the hope for a brighter 2022 is glimmering. Let's hope it glimmers like gold and not pyrite. In the meantime, it's time for another metagame update.
November's metagame represents both a continuation of October's and a significant change. The overall population is slightly below Octobers at 514 to 545. The number of events was slightly lower thanks to fewer usable reported non-Wizards events on MTGMelee. I think the actual number of reported events was the same, but there were more that were too small to make the cut. There are a number of groups that hold events that are comparable to Preliminaries and usually produce similar data. This month there were more that only had three rounds. The four that Preliminaries have is already borderline for good data. I'm not sure why this is happening beyond all online results being very volatile, which even played out in the overall data.
I also want to preempt everything by saying that the results from Not-GP Las Vegas are not included in this analysis. It would skew the data as the only paper result. Including the Top 32 results would change nothing about the population data but would heavily skew the power chart using the current point system. If I tried to include more paper results Vegas would outweigh everything and the data would skew anyway. Best to wait for more paper events to exist before trying to mesh the paper and online results.
October Metagame
To make the tier list, a given deck has to beat the overall average population for the month. The average is my estimate for how many results a given deck “should” produce on MTGO. Being a tiered deck requires being better than “good enough;” in November the average population was 6.06 with rounding and saying that's sufficient to push the cutoff up to 7 results is 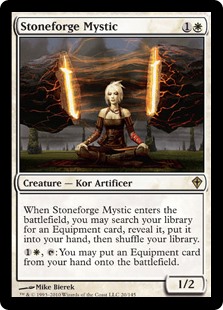 way too nit-picky for my taste. Therefore, a deck needs 6 results to make Tier 3. The streak of sevens has finally been broken. Given that there was never a reason for such a streak, the fact that it was broken means nothing. However, there is more to this cutoff than it appears.
Tier 3 begins with decks posting 6 results. Then we go one standard deviation above average to set the limit of Tier 3 and cutoff for Tier 2. The STdev was 8.48, which means that means Tier 3 runs to 15. Again, it's the starting point to the cutoff, then one above for the next Tier. Therefore Tier 2 starts with 16 results and runs to 25. Subsequently, to make Tier 1, 26 decks are required. If all of those numbers seem low given the usual spread for the metagame update, they are. And there's a very good reason for that, one I've dealt with previously.
Another Outlier
Back in May, Izzet Prowess outstripped every other deck by sufficient margin to be considered an outlier. Which I did by reporting its results but not including it in the actual analysis. I'm doing it again this month. However, there is a small twist. Izzet Prowess was the 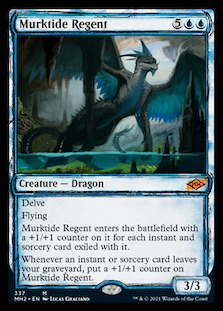 lone outlier last time but this time both UR Murktide and Hammer Time are being excluded. Every month I check for outliers and am sometimes surprised when I don't have any. I really thought Hammer Time and Murktide were outliers last July, but the tests disagreed. This time every test said that Hammer Time is over the line. Murktide, on the other hand, was sometimes over and sometimes right on the line. Given that when I excluded Hammer but not Murktide from the data there was no meaningful change but excluding them both affected the standings, I decided to treat both as outliers.
This does not make them Tier 0 decks. As the rest of the data shows, they're not outperforming other decks per capita. This is also the results for one month. If they repeat the feat in December, that's another story.
The Tier Data
While the total population is slightly down from October, the number of unique decks fell by quite a bit. Where 78 unique decks were recorded in October, I only have 67 for November. With the top two decks soaking up the results there wasn't room for more decks to place. It's also expected for diversity to fall slightly in a more established metagame. Why play something new rather than something good? As long as the fall isn't too great, there's no problem. That said, thanks to the excluded outliers, the lower floor allowed more decks to make the tier list and that's up to 19 from 15 in October.
| Deck Name | Total # | Total % |
|---|---|---|
| Tier 1 | ||
| Hammer Time | 62 | 12.96 |
| UR Murktide | 58 | 12.28 |
| UW Control | 38 | 9.64 |
| Grixis Death's Shadow | 30 | 7.61 |
| 4-Color Blink | 29 | 7.36 |
| 4-Color Control | 27 | 6.85 |
| Amulet Titan | 27 | 6.85 |
| Tier 2 | ||
| Jund Saga | 23 | 5.84 |
| Cascade Crashers | 18 | 4.57 |
| Burn | 17 | 4.31 |
| Tier 3 | ||
| Yawgmoth | 13 | 3.30 |
| Belcher | 13 | 3.30 |
| 4-Color Bring to Light | 12 | 3.05 |
| Blue Living End | 11 | 2.79 |
| Mill | 11 | 2.79 |
| Rakdos Rock | 9 | 2.28 |
| Ponza | 7 | 1.78 |
| 4-Color Creativity | 6 | 1.52 |
| Dredge | 6 | 1.52 |
So yeah, Hammer Time and Murktide outstripped UW Control by a wide margin. Not as wide as what happened in July, which is odd. I may have made a mistake, but it's also possible that the more tightly clustered data precluded outliers in July. That can happen when there are huge gaps but all the data falls along a valid trend line. That seems not to have happened here. The huge number of decks in Tier 1 is a function of excluding the outliers. Without that only UW would have joined the top 2 in Tier 1. Everything down to Jund Saga was Tier 2.
How'd This Happen?
I don't have a great explanation for there being outliers this time, nor any of the other oddities of this Tier data. Burn and Cascade Crashers falling down to Tier 2 despite the metagame looking broadly similar to October's is fairly inexplicable, as is Murktide surging out of Tier 2. At the same time, where did Grixis Death's Shadow come from? Seriously, it 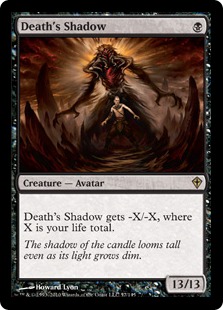 hasn't been a Tiered deck in months. There has always been a pilot or two sticking to the old warhorse, but even in good months GDS has been at the bottom Tier 3. And yet it's surged into Tier 1, apparently all thanks to Death's Shadow comboing with Dress Down. More surprisingly, it was a very sudden surge. GDS didn't cross the Tier 3 threshold until (roughly) November 19. And I don't know why.
And I may not need to know why any of this happened. As I mentioned up the page, MTGO is extremely volatile. Decks fall off because players get bored of playing them and/or their rental time is up. Decks surge because a streamer did well with it and all their followers have to try it. Did that happen in November? I don't know for certain. But I advise everyone to assume that a shocking fluctuation is just a quirk until it is proven to be not a quirk.
Piling On
I also need to address the multi-colored slop in the room. There's a convincing argument for treating 4-Color Blink and 4-Color Control as the same deck. The only consistent difference between the two is that Blink plays Ephemerate. They have the exact 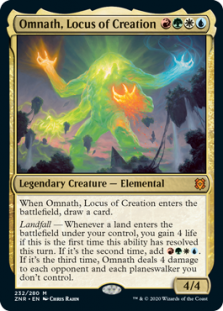 same core of Prismatic Ending, Wrenn and Six, Teferi, Time Raveler, Omnath, Locus of Creation, and Solitude. It's just a question of the support spells around the core, with Blink being more midrange. The Bring to Light and Indomitable Creativity decks share some of this core but retain unique identities.
That isn't inherently bad, but it also isn't good. We were in a similar situation with Uro, Titan of Nature's Wrath decks in 2019 and look where that ended. This is not the same situation, but I can definitely see it from here. The issue is that it isn't one card pushing towards homogeneity, but the sum total of a lot of things. The post-MH2 reality ensures that Ending and Teferi are seeing play everywhere. Wrenn is necessary to make the manabases work. Omnath is the best payoff for an already 4+ color deck. What's weird is that Blood Moon is fairly absent. Ponza made Tier 3, but you'd think it would be more of a presence. These piles are far more vulnerable to Moon than Uro was, so I'd hope that is enough to contain the piles. I'm not hopeful, though; its current absence isn't promising.
Power Rankings
Tracking the metagame in terms of population is standard practice. But how do results actually factor in? Better decks should also have better results. In an effort to measure this, I use a power ranking system in addition to the prevalence list. By doing so, I measure the relative strengths of each deck within the metagame. The population method gives a deck 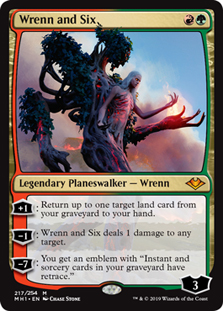 that consistently just squeaks into Top 32 the same weight as one that Top 8’s. Using a power ranking rewards good results and moves the winningest decks to the top of the pile and better reflects its metagame potential.
Points are awarded based on the population of the event. Preliminaries award points for record (1 for 3 wins, 2 for 4 wins, 3 for 5) and Challenges are scored 3 points for Top 8, 2 for Top 16, 1 for Top 32. If I can find them, non-Wizards events will be awarded points the same as Challenges or Preliminaries are depending on what the event in question reports/behaves like. Super Qualifiers and similar higher-level events get an extra point and so do other events if they’re over 200 players, with a fifth point for going over 400 players. There were three 4 points events in October and no 5 pointers.
The Power Tiers
Just like with population, the total points were down slightly in November. There are 927 total points in November compared to October's 955. Again, this is on the higher end for the returned metagame updates, but below what I was seeing last year. Worth noting that if I'd included Vegas November's points would have far outstripped October's. That's what a single 5-point event allows but given the starting population Vegas really should receive more points than that. Something I have to figure out in the near future.
The average points were 11.00 exactly. Which is extremely surprising and statistically unlikely, but that's what happened. Removing the outlier's points permitted this to happen, but even then it's extremely unlikely. Therefore 11 points makes Tier 3. The STDev was 15.64, which is on the lower end. Thus add 16 to the starting point and Tier 3 runs to 27 points. Tier 2 starts with 28 points and runs to 44. Tier 1 requires at least 45 points.
| Deck Name | Total # | Total % |
|---|---|---|
| Tier 1 | ||
| Hammer Time | 108 | 15.10 |
| UR Murktide | 104 | 14.55 |
| UW Control | 72 | 10.07 |
| Grixis Death's Shadow | 56 | 7.83 |
| 4-Color Blink | 54 | 7.55 |
| Amulet Titan | 50 | 6.99 |
| 4-Color Control | 48 | 6.71 |
| Tier 2 | ||
| Jund Saga | 41 | 5.73 |
| Cascade Crashers | 29 | 4.06 |
| Burn | 28 | 3.92 |
| Tier 3 | ||
| Belcher | 25 | 3.50 |
| Yawgmoth | 23 | 3.22 |
| Blue Living End | 23 | 3.22 |
| Mill | 23 | 3.22 |
| 4-Color Bring to Light | 18 | 2.52 |
| Rakdos Rock | 16 | 2.24 |
| Dredge | 13 | 1.82 |
| Merfolk | 12 | 1.68 |
| Tribal Elementals | 12 | 1.68 |
| 4-Color Creativity | 11 | 1.54 |
Ponza didn't earn enough points to make the power tiers. The perennial also-ran. However, both Tribal Elementals and Merfolk had enough points to squeak in, so the power tier is larger than the population. However, beyond that there's not much to see. No deck jumped between tiers and within tiers there was a minimal amount of reshuffling. The collective wisdom was relatively spot on this time.
Average Power Rankings
Finally, we come to the average power rankings. These are found by taking total points earned and dividing it by total decks, which measures points per deck. I use this to measure 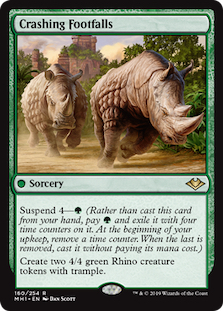 strength vs. popularity. Measuring deck strength is hard. There is no Wins-Above-Replacement metric for Magic, and I'm not certain that one could be credibly devised. The game is too complex, and even then, power is very contextual. Using the power rankings certainly helps and serves to show how justified a deck’s popularity is. However, more popular decks will still necessarily earn a lot of points. Which tracks, but also means that the top tier doesn't move much between population and power, and obscures whether they really earned their position.
This is where the averaging comes in. Decks that earn a lot of points because they get a lot of results will do worse than decks that win more events, indicating which deck actually performs better. A higher average indicates lots of high finishes, where low averages result from mediocre performances and high population. Lower-tier decks typically do very well here, likely due to their pilots being enthusiasts. So be careful about reading too much into the results. However, as a general rule decks which place higher than the baseline average are overperforming and vice versa. How far above or below that average determines how "justified" a decks position on the power tiers are. Decks well above baseline are therefore undervalued while decks well below baseline are very popular but necessarily especially good.
The Real Story
While the extra-point events had a significant impact on standings, it wasn't enough to really distort the data unlike in October. This is primarily because results were less clustered than before. In October, Hammer Time did disproportionately well in the PTQs which saved it from a mediocre at best finish in average power. In November, many decks did well in the events and so the data better reflects the real spread.
| Deck Name | Average Power | Power Tier |
|---|---|---|
| Tribal Elementals | 3.00 | 3 |
| Merfolk | 2.40 | 3 |
| Dredge | 2.17 | 3 |
| Blue Living End | 2.09 | 3 |
| Mill | 2.09 | 3 |
| Belcher | 1.92 | 3 |
| UW Control | 1.89 | 1 |
| Grixis Death's Shadow | 1.87 | 1 |
| 4-Color Blink | 1.86 | 1 |
| Amulet Titan | 1.85 | 1 |
| 4-Color Creativity | 1.83 | 3 |
| Baseline | 1.80 | |
| UR Murktide | 1.79 | 1 |
| 4-Color Control | 1.78 | 1 |
| Jund Saga | 1.78 | 2 |
| Rakdos Rock | 1.78 | 3 |
| Yawgmoth | 1.77 | 3 |
| Hammer Time | 1.74 | 1 |
| Burn | 1.65 | 2 |
| Cascade Crashers | 1.61 | 2 |
| 4-Color Bring to Light | 1.50 | 3 |
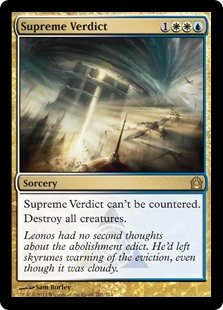 And there's the main reason that Hammer Time and UR Murktide shouldn't be considered Tier 0: they're both under the baseline stat. Murktide is just below, which means it's effectively tied and thus performing in accordance with what I'd expect from a popular deck. Hammer Time slightly underperformed. That's a sign that Hammer is very popular online, but also very beatable. More than it's given credit for. Meanwhile, the best performing high-tier deck and thus the deck of November is UW Control. Nobody tell Shaheen Soorani.
Tribal Elementals is the first deck to get 3 points on average. However, don't celebrate yet: that was done with 4 decks. When a deck Top 8's events, it will see a huge boost in the rankings, but if that's the only place it shows up, then it means nothing. Some specialists had a good event, and this achievement says more about the pilots than the deck. Make it a consistent thing or place more decks if you want me to take it seriously.
Winding Down
So do we close the books on November. December is usually a relatively quiet month for Magic, but this continues to be an unusual time. However, the metagame will continue to evolve and we'll see what happens come January.
