Are you a Quiet Speculation member?
If not, now is a perfect time to join up! Our powerful tools, breaking-news analysis, and exclusive Discord channel will make sure you stay up to date and ahead of the curve.
New month, new Modern metagame update. This is the first look at what is technically a new metagame. There was just a ban after all, but how impactful it's been overall is currently unclear. Only one deck was seriously impacted, and it could (theoretically) absorb the hit without issue. Whether this changed the metagame significantly has yet to be seen.
I do need to lead with the disclaimer that the data is truncated in October due to the aforementioned ban. Ten days' worth of data was invalidated. Those days included a number of very large events. Consequently, the few large events that happened later in the month have an outsized impact on the data. Keep both problems in mind as I go through what data I have. November's update will have a more complete data set.
The More Things Change...
I've spent most of this year discussing the problem of outliers in the data. UR Murktide has consistently been overrepresented in the data, frequently joined by another deck, with Hammer Time being the most common offender. I had a vague hope that this might change post-Yorion, Sky Nomad. And it has...kinda.
UR Murktide is still an outlier, but only for Magic Online (MTGO). The data distribution of the paper results doesn't support designating any deck as an outlier in those results. It's quite close, but Murktide is being shadowed both online and in person by Rakdos Scam. Scam is quite close to the line in both mediums but never crosses it, so no additional outlier. Murktide is an outlier over Scam online, so it remains an outlier. In paper they're close enough that Scam keeps Murktide from outlier status.
October Population Metagame
To make the tier list, a given deck has to beat the overall average population for the month. The average is my estimate for how many results a given deck “should” produce in a given month. Being a tiered deck requires being better than “good enough.” Every deck that posts at least the average number of results is "good enough" and makes the tier list. Then we go one standard deviation (STdev) above average to set the limit of Tier 3 and the cutoff for Tier 2. This mathematically defines Tier 3 as those decks clustered near the average. Tier 2 goes from the cutoff to the next standard deviation. These are decks that perform well above average. Tier 1 consists of those decks at least two standard deviations above the mean result, encompassing the truly exceptional performing decks.
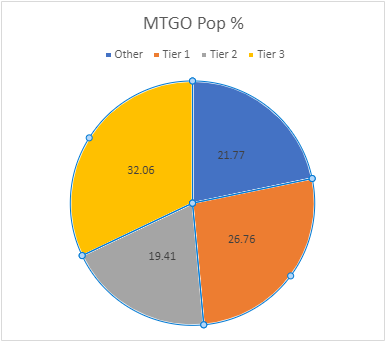
The MTGO Population Data
In October the adjusted average population for MTGO was 5.35 setting the Tier 3 cutoff at six decks. This is a low average, but it's what I expect in a truncated month. Tier 3, therefore, begins with decks posting six results. The STdev was 6.09, which means that Tier 3 runs to 12 results. Again, it's the starting point to the cutoff, then the next whole number for the next Tier. Since 6.09 is so close to 6.00, I rounded down for October. Therefore Tier 2 starts with 13 results and runs to 19. Subsequently, to make Tier 1, 20 decks are required.
To recap, January had 502 decks, February had 436 decks, March only hit 356, April was up to 437, May had 419, June had 481, July was 478, August was 507 decks, and September crashed to 404 decks. October hit a low of 340 decks, but that makes sense given the banning. I recorded over 100 decks before the ban and had to throw them out. Oddly, the number of individual decks only fell slightly from 59 to 57. Players like to experiment after a ban. Of those 57 decks, 19 made the population tier.
| Deck Name | Total # | Total % |
|---|---|---|
| Tier 1 | ||
| UR Murktide | 40 | 11.76 |
| Rakdos Scam | 27 | 7.94 |
| Hammer Time | 24 | 7.06 |
| Tier 2 | ||
| 4-Color Creativity | 18 | 5.29 |
| Yawgmoth | 16 | 4.71 |
| Jeskai Breach Combo | 16 | 4.71 |
| Burn | 16 | 4.71 |
| Tier 3 | ||
| 4-Color Rhinos | 12 | 3.53 |
| 4-Color Control | 12 | 3.53 |
| Amulet Titan | 12 | 3.53 |
| Mono-Green Tron | 11 | 3.23 |
| UW Control | 11 | 3.23 |
| Countercat | 9 | 2.65 |
| Temur Creativity | 8 | 2.35 |
| UW Urza | 8 | 2.35 |
| Mill | 7 | 2.06 |
| Living End | 7 | 2.06 |
| Izzet Prowess | 6 | 1.76 |
| Merfolk | 6 | 1.76 |
The top two tiers are smaller than I've been used to this year. The relative lack of outliers is certainly a factor, but there were a number of decks that dropped precipitously. Living End fell all the way from Tier 1 to Tier 3, and I don't have any explanation for why. My best guess is that losing the 4-Color Blink matchup really hurt, but I'd think that it would trade off with fewer Endurances seeing play.
On that note, there are some new names to address. Cascade Crashers doesn't appear on the Tier list, replaced by 4-Color Rhinos. The former is the Temur tempo deck that's been solid in Modern for over a year. The latter is effectively a 4-Color soup united only by Crashing Footfalls. I keep track of which is which and record them separately. Similarly, Countercat refers to the Domain Zoo deck that runs counterspells, typically Stubborn Denial. The former deck made the Tier list, the latter did not.
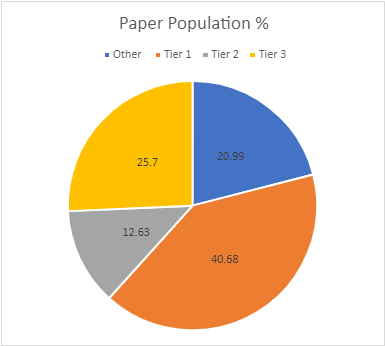
The Paper Population Data
The paper tiers are calculated the same way as the MTGO tiers, just with different data. More paper events are reported each month, but they rarely report more than the Top 8 (sometimes less). However, that doesn't mean that the overall population is lower. July had 783 decks, June had 640, and August recorded 594. September saw a surge up to 748 decks. The truncated data for October had 467 decks.
Consequently, the number of unique decks is also down. September saw 94 decks while 79 showed up in October. 23 of those decks made the tier list. The average population was 5.91, so six decks make Tier 3. The STDev was 8.80, so the increment is nine. I round down if the decimal is less than .20. Therefore, Tier 3 runs from 6 to 15, Tier 2 is 16 to 25, and Tier 1 is 26 and over. More importantly, a lack of outliers this month meant that I didn't have to adjust any of this! This is the first time that's happened in six months.
| Deck Name | Total # | Total % |
|---|---|---|
| Tier 1 | ||
| UR Murktide | 43 | 9.21 |
| Rakdos Scam | 37 | 7.92 |
| 4-Color Creativity | 29 | 6.21 |
| 4-Color Rhinos | 28 | 6.00 |
| Hammer Time | 27 | 5.78 |
| Burn | 26 | 5.57 |
| Tier 2 | ||
| Yawgmoth | 22 | 4.71 |
| UW Control | 19 | 4.07 |
| Amulet Titan | 18 | 3.85 |
| Tier 3 | ||
| 5-Color Creativity | 15 | 3.21 |
| Jeskai Breach Combo | 12 | 2.57 |
| 4-Color Control | 11 | 2.35 |
| Merfolk | 11 | 2.35 |
| Living End | 10 | 2.14 |
| Grixis Shadow | 9 | 1.93 |
| Countercat | 9 | 1.93 |
| Mono-Green Tron | 7 | 1.50 |
| Dredge | 6 | 1.28 |
| Hardened Scales | 6 | 1.28 |
| Temur Shift | 6 | 1.28 |
| Mill | 6 | 1.28 |
| Rakdos Rock | 6 | 1.28 |
| Affinity | 6 | 1.28 |
As I mentioned, there is a big gap between Murktide, Scam, and the rest of Tier 1. It's not big enough to call them outliers, but it is close. This pull on the data is why there are six decks in Tier 1 and only two in Tier 2.
While paper's results are similar to MTGO's, there were a lot more Indomitable Creativity variants in the data, including one that made the Tier list. Almost all the Creativity lists online were blue, red, white, and green. In paper, all the three-or-more color combinations showed up. I'm not sure what, if anything, that implies about the deck. Note that the dividing line between 4- and 5-Color Creativity was the number of non-Archon of Cruelty black cards (typically). Two or fewer counts as a splash while three or more is an actual commitment.
October Power Metagame
Tracking the metagame in terms of population is standard practice. But how do results actually factor in? Better decks should also have better results. In an effort to measure this, I use a power ranking system in addition to the prevalence list. By doing so, I measure the relative strengths of each deck within the metagame. The population method gives a deck that consistently just squeaks into the Top 32 the same weight as one that Top 8's. Using a power ranking rewards good results and moves the winningest decks to the top of the pile and better reflects their metagame potential.
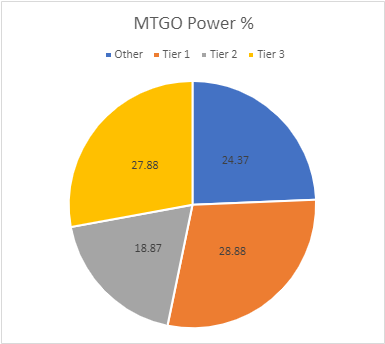
The MTGO Power Tiers
For the MTGO data, points are awarded based on the population of the event. Preliminaries award points based on record (1 for 3 wins, 2 for 4 wins, 3 for 5), and Challenges are scored 3 points for the Top 8, 2 for Top 16, and 1 for Top 32. If I can find them, non-Wizards events will be awarded points the same as Challenges or Preliminaries depending on what the event in question reports/behaves like. Super Qualifiers and similar higher-level events get an extra point and so do other events if they’re over 200 players, with a fifth point for going over 400 players. There were no four-point events, but the Showcase Qualifier hit the five-point threshold. Consequently, it had an outsized effect on the data, amplified by the short month.
Total points fell less than expected, unlike the population, from 697 to 599. The adjusted average points were 9.36, therefore 10 points made Tier 3. The STDev was 11.36, which is average. Thus add 12 to the starting point and Tier 3 runs to 22 points. Tier 2 starts with 23 points and runs to 35. Tier 1 requires at least 36 points.
Sadly for me, Merfolk didn't meet the points threshold. It was replaced by Hardened Scales which did very well in a few events but had little success overall.
| Deck Name | Total Points | Total % |
|---|---|---|
| Tier 1 | ||
| UR Murktide | 75 | 12.52 |
| Rakdos Scam | 55 | 9.18 |
| Hammer Time | 43 | 7.18 |
| Tier 2 | ||
| Yawgmoth | 32 | 5.34 |
| Jeskai Breach Combo | 28 | 4.67 |
| Burn | 27 | 4.51 |
| 4-Color Creativity | 26 | 4.34 |
| 4-Color Rhinos | 25 | 4.17 |
| Amulet Titan | 25 | 4.17 |
| Tier 3 | ||
| 4-Color Control | 19 | 3.17 |
| Living End | 18 | 3.00 |
| UW Control | 17 | 2.84 |
| Temur Creativity | 16 | 2.67 |
| Mono-Green Tron | 14 | 2.34 |
| UW Urza | 14 | 2.34 |
| Countercat | 13 | 2.17 |
| Mill | 11 | 1.84 |
| Izzet Prowess | 10 | 1.66 |
| Hardened Scales | 10 | 1.66 |
Tier 1 took up an inordinate amount of the available points, which is really bad considering it only has three decks. However, it needs to be mentioned that all the Tier 1 decks were overrepresented in the Showcase Qualifier and so have an unfair advantage. This is a very bad look, but it isn't necessarily actually bad.
The Paper Power Tiers
Unlike with population, the paper power data works differently than the equivalent MTGO data. The data reported is usually limited to the Top 8 lists, even for big events. Not that I know how big most events are, as that number doesn't always get reported. In other cases, decks are missing. Applying the MTGO point system just doesn't work when I don't know how many points to award and there are data gaps.
Thus, I award points based on the size of the tournament rather than placement. That way I'm being internally consistent with the paper results. The current system is that for events that don't report their starting populations or are under 50 players, I'm giving out 1 point. 51-300 players get 2 points. 301 and above get 3 points. I chose these levels based on the rarity of events over 300 compared to 100-200 and the fact that events under 300 tend to be local events in large cities. It feels like it should be 300 for truly unique events, despite there being no Grand Prix yet. I will be changing how the points are allocated next year.
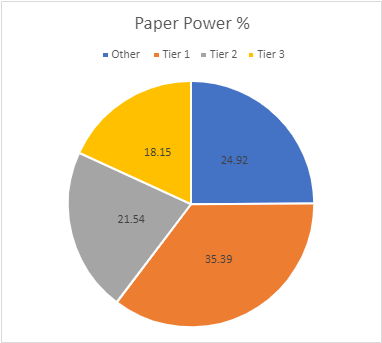
There were a huge number of events awarding 2 points in July and several 3-point events as well. Altogether October had 650 points, well down from September's 1068 points, but again that's to be expected in a truncated month.
The average points were 8.23. This sets the cutoff at nine decks. The STDev was 12.49, thus adding 13 to the starting point and Tier 3 runs to 22 points. Tier 2 starts with 23 points and runs to 35. Tier 1 requires at least 36 points. The total decks fell from 23 to 18. The only deck with six instances that also had enough points to qualify was Dredge.
| Deck Name | Total # | Total % |
|---|---|---|
| Tier 1 | ||
| UR Murktide | 57 | 8.76 |
| Rakdos Scam | 55 | 8.46 |
| 4-Color Creativity | 41 | 6.30 |
| Hammer Time | 41 | 6.30 |
| 4-Color Rhinos | 36 | 5.54 |
| Tier 2 | ||
| Burn | 34 | 5.23 |
| Yawgmoth | 31 | 4.77 |
| Jeskai Breach Combo | 28 | 4.31 |
| UW Control | 24 | 3.69 |
| Amulet Titan | 23 | 3.54 |
| Tier 3 | ||
| 5-Color Creativity | 21 | 3.23 |
| 4-Color Control | 20 | 3.08 |
| Merfolk | 17 | 2.61 |
| Grixis Shadow | 14 | 2.15 |
| Living End | 13 | 2.00 |
| Countercat | 12 | 1.85 |
| Dredge | 11 | 1.69 |
| Mono-Green Tron | 10 | 1.54 |
Average Power Rankings
Finally, we come to the average power rankings. These are found by taking the total points earned and dividing them by total decks, to measure points per deck. I use this to measure strength vs. popularity. Measuring deck strength is hard. There is no Wins-Above-Replacement metric for Magic, and I'm not certain that one could be credibly devised. The game is too complex, and even then, power is very contextual. Using the power rankings certainly helps and serves to show how justified a deck’s popularity is. However, more popular decks will still necessarily earn a lot of points. Which tracks, but also means that the top tier doesn't move much between population and power, and obscures whether they really earned their position.
This is where the averaging comes in. Decks that earn a lot of points because they get a lot of results will do worse than decks that win more events, indicating which deck actually performs better. A higher average indicates lots of high finishes, whereas low averages result from mediocre performances and a high population. Lower-tier decks typically do very well here, likely due to their pilots being enthusiasts. Bear this in mind, and be careful about reading too much into these results. However, as a general rule, decks which place above the baseline average are overperforming and vice versa. How far above or below that average determines how "justified" a deck's position is on the power tiers. Decks well above baseline are therefore undervalued while decks well below baseline are very popular but aren't necessarily good.
The Real Story
When considering the average points, the key is looking at how far-off a deck is from the Baseline stat (the overall average of points/population). The closer a deck’s performance to the Baseline, the more likely it is to be performing close to its “true” potential. A deck that is exactly average would therefore perform exactly as well as expected. The greater the deviation from the average, the more a deck under or over-performs. On the low end, a deck’s placing was mainly due to population rather than power, which suggests it’s overrated. A high-scoring deck is the opposite of this.
I'll begin with the average for MTGO:
| Deck Name | Average Points | Power Tier |
|---|---|---|
| Living End | 2.57 | 3 |
| 4-Color Rhinos | 2.08 | 2 |
| Amulet Titan | 2.08 | 2 |
| Rakdos Scam | 2.04 | 1 |
| Yawgmoth | 2.00 | 2 |
| Temur Creativity | 2.00 | 3 |
| Hardened Scales | 2.00 | 3 |
| UR Murktide | 1.87 | 1 |
| Hammer Time | 1.79 | 1 |
| Jeskai Breach Combo | 1.75 | 2 |
| UW Urza | 1.75 | 3 |
| Baseline | 1.69 | |
| Burn | 1.69 | 2 |
| Izzet Prowess | 1.67 | 3 |
| 4-Color Control | 1.58 | 3 |
| Mill | 1.57 | 3 |
| UW Control | 1.55 | 3 |
| 4-Color Creativity | 1.44 | 2 |
| Countercat | 1.44 | 3 |
| Mono-Green Tron | 1.27 | 3 |
Congratulations to Rakdos Scam! As the best-performing Tier 1 deck, it's the MTGO deck of October. Don't get too big a head though, this performance is down to the impressive showing in the Showcase Qualifier.
Then the average for paper:
| Deck Name | Average Points | Power Tier |
|---|---|---|
| Jeskai Breach Combo | 2.33 | 2 |
| Dredge | 1.83 | 3 |
| 4-Color Control | 1.82 | 3 |
| Grixis Shadow | 1.56 | 3 |
| Merfolk | 1.55 | 3 |
| Hammer Time | 1.52 | 1 |
| Rakdos Scam | 1.49 | 1 |
| Mono-Green Tron | 1.43 | 3 |
| 4-Color Creativity | 1.41 | 1 |
| Yawgmoth | 1.41 | 2 |
| 5-Color Creativity | 1.40 | 3 |
| Baseline | 1.33 | |
| UR Murktide | 1.33 | 1 |
| Countercat | 1.33 | 3 |
| Burn | 1.31 | 2 |
| Living End | 1.30 | 3 |
| 4-Color Rhinos | 1.29 | 1 |
| Amulet Titan | 1.28 | 2 |
| UW Control | 1.26 | 2 |
Well done Hammer Time, you're the paper deck of October. What's going on with Living End? It falls out of Tier 1 and also fell in the paper averages despite having the best average online.
Composite Metagame
That's a lot of data, but what does it all mean? When Modern Nexus first started, we had a statistical method to combine the MTGO and paper data, but the math of that system doesn't work without big paper events. I tried. Instead, I'm using an averaging system to combine the data. I take the MTGO results and average the tier, then separately average the paper results, then average the paper and MTGO results together for final tier placement.
This generates a lot of partial Tiers. That's not a bug, it's a feature. The nuance separates the solidly Tiered decks from the more flexible ones and shows the true relative power differences between the decks. Every deck in the paper and MTGO results is on the table, and when they don't appear in a given category, they're marked N/A. This is treated as a 4 for averaging purposes.
| Deck Name | MTGO Population Tier | MTGO Power Tier | MTGO Average Tier | Paper Population Tier | Paper Power Tier | Paper Average Tier | Composite Tier |
|---|---|---|---|---|---|---|---|
| UR Murktide | 1 | 1 | 1.00 | 1 | 1 | 1.00 | 1.00 |
| Rakdos Scam | 1 | 1 | 1.00 | 1 | 1 | 1.00 | 1.00 |
| Hammer Time | 1 | 1 | 1.00 | 1 | 1 | 1.00 | 1.00 |
| 4-Color Creativity | 2 | 2 | 2.00 | 1 | 1 | 1.00 | 1.50 |
| Burn | 2 | 2 | 2.00 | 1 | 2 | 1.50 | 1.75 |
| 4-Color Rhinos | 3 | 2 | 2.50 | 1 | 1 | 1.00 | 1.75 |
| Yawgmoth | 2 | 2 | 2.00 | 2 | 2 | 2.00 | 2.00 |
| Jeskai Breach Combo | 2 | 2 | 2.00 | 3 | 2 | 2.50 | 2.25 |
| Amulet Titan | 3 | 2 | 2.50 | 2 | 2 | 2.00 | 2.25 |
| UW Control | 3 | 3 | 3.00 | 2 | 2 | 2.00 | 2.50 |
| 4-Color Control | 3 | 3 | 3.00 | 3 | 3 | 3.00 | 3.00 |
| Mono-Green Tron | 3 | 3 | 3.00 | 3 | 3 | 3.00 | 3.00 |
| Countercat | 3 | 3 | 3.00 | 3 | 3 | 3.00 | 3.00 |
| Living End | 3 | 3 | 3.00 | 3 | 3 | 3.00 | 3.00 |
| Mill | 3 | 3 | 3.00 | 3 | N/A | 3.50 | 3.25 |
| Merfolk | 3 | N/A | 3.50 | 3 | 3 | 3.00 | 3.25 |
| Dredge | N/A | N/A | N/A | 3 | 3 | 3.00 | 3.50 |
| Temur Creativity | 3 | 3 | 3.00 | N/A | N/A | N/A | 3.50 |
| UW Urza | 3 | 3 | 3.00 | N/A | N/A | N/A | 3.50 |
| Izzet Prowess | 3 | 3 | 3.00 | N/A | N/A | N/A | 3.50 |
| Hardened Scales | N/A | 3 | 3.50 | 3 | N/A | 3.50 | 3.50 |
| Grixis Shadow | N/A | N/A | N/A | 3 | 3 | 3.00 | 3.50 |
| 5-Color Creativity | N/A | N/A | N/A | 3 | 3 | 3.00 | 3.50 |
| Temur Shift | N/A | N/A | N/A | 3 | N/A | 3.50 | 3.75 |
| Rakdos Rock | N/A | N/A | N/A | 3 | N/A | 3.50 | 3.75 |
| Affinity | N/A | N/A | N/A | 3 | N/A | 3.50 | 3.75 |

Unsurprisingly, the top three decks from both paper and online are the only pure Tier 1 decks. October's data is also just generally bottom-heavy compared to September's data. That might just be the result of overall metagame instability.
Things Won't Stay the Same
October saw Modern shaken up by Leyline Binding entering the format, and Yorion being banned. There is more turmoil on the horizon as The Brothers' War is bringing Karn, the Great Creator and Urza's Saga a bunch of potentially overpowered toys. I don't expect Modern to be stable anytime soon.
QS Insiders can tune in this Friday when I unpack some of this month's data and share my thoughts on its implications. If you're not an Insider, consider subscribing today!
