Are you a Quiet Speculation member?
If not, now is a perfect time to join up! Our powerful tools, breaking-news analysis, and exclusive Discord channel will make sure you stay up to date and ahead of the curve.
It's the penultimate Modern metagame update of 2022. How this year has lurched by. October saw a ban and thus provided incomplete data. November is the first chance to examine the complete monthly data for the post-Yorion, the Sky Nomad metagame. Which is somewhat facetious, as the more things have changed, the more they've stayed exactly the same.
Continuing Continuity, Differentiating Divergence
UR Murktide has been a statistical outlier in the Magic Online (MTGO) data every metagame update since March, and it continues to be one in November. With two exceptions: it has also been an outlier in the paper results. October was the first exception to outlier status since April. I now need to edit the earlier statement to say three exceptions, since Murktide isn't an outlier in paper Modern again. It isn't even the top deck.
In fact, paper doesn't have any outliers. This might be a good sign, indicative of Modern adjusting and adapting. On the other hand, there are confounding factors at play that I'll get to down the page.
MTGO made up for that by having three outliers. Both Hammer Time and Rakdos Scam were well over the minimum threshold to be considered statistical outliers. As always, outliers are in their correct place on the metagame chart but are excluded from the actual calculations, resulting in an adjusted average and standard deviation.
November Population Metagame
To make the tier list, a given deck has to beat the overall average population for the month. The average is my estimate for how many results a given deck "should” produce in a given month. Being a tiered deck requires being better than “good enough.” Every deck that posts at least the average number of results is "good enough" and makes the tier list. Then we go one standard deviation (STdev) above average to set the limit of Tier 3 and the cutoff for Tier 2. This mathematically defines Tier 3 as those decks clustered near the average. Tier 2 goes from the cutoff to the next standard deviation. These are decks that perform well above average. Tier 1 consists of those decks at least two standard deviations above the mean result, encompassing the truly exceptional performing decks.
The MTGO Population Data
In November the adjusted average population for MTGO was 5.33, setting the Tier 3 cutoff at six decks. This is a low average and .02 below October's average, but with three excluded outliers it makes sense. Tier 3, therefore, begins with decks posting six results. The STdev was 6.05, which means that Tier 3 runs to 12 results. Again, it's the starting point to the cutoff, then the next whole number for the next Tier. Since 6.05 is so close to 6.00, I rounded down for October. Therefore Tier 2 starts with 13 results and runs to 19. Subsequently, to make Tier 1, 20 decks are required. This is the exact same set of cutoffs as October, coincidentally.
To recap, January had 502 decks, February had 436 decks, March only hit 356, April was up to 437, May had 419, June had 481, July was 478, August was 507, September had 404, and October fell to 340 decks. November shot up to 569 decks, the highest of 2022.
Which is not (necessarily) a sign of format health and popularity. MTGO is under new management, and they release more data than Wizards did. Wizards always released the results from Challenge-level events and no more than five Preliminaries every week. Daybreak Games has been releasing every event that fires. I hope it continues as there were three more Prelims on average than before, which means more complete data for me. November was also special thanks to extra events from the Last Chance Qualifiers.
The number of individual decks was up significantly from 57 to 74. More data equals more decks. Of those 74 decks, 27 made the population tier. That is quite high as these go, though it would be lower without the outliers.
| Deck Name | Total # | Total % |
|---|---|---|
| Tier 1 | ||
| UR Murktide | 79 | 13.88 |
| Hammer Time | 62 | 10.90 |
| Rakdos Scam | 49 | 8.61 |
| Amulet Titan | 25 | 4.39 |
| UW Control | 24 | 4.22 |
| 4-Color Creativity | 20 | 3.51 |
| Burn | 20 | 3.51 |
| Tier 2 | ||
| Jeskai Breach Combo | 19 | 3.34 |
| Yawgmoth | 19 | 3.34 |
| 4-Color Control | 16 | 2.81 |
| Living End | 15 | 2.64 |
| Merfolk | 14 | 2.46 |
| Tier 3 | ||
| Counter Cat | 12 | 2.11 |
| Bring to Light | 10 | 1.76 |
| Hardened Scales | 10 | 1.76 |
| Mono-Green Tron | 8 | 1.41 |
| Mono-Red Artifacts | 8 | 1.41 |
| 5-Color Creativity | 8 | 1.41 |
| 4-Color Rhinos | 8 | 1.41 |
| Grixis Death's Shadow | 8 | 1.41 |
| Goblins | 7 | 1.23 |
| Calibrated Blast | 7 | 1.23 |
| Jund Saga | 7 | 1.23 |
| Temur Breach Comob | 6 | 1.05 |
| UW Urza | 6 | 1.05 |
| Mill | 6 | 1.05 |
| Hell's Kitchen | 6 | 1.05 |
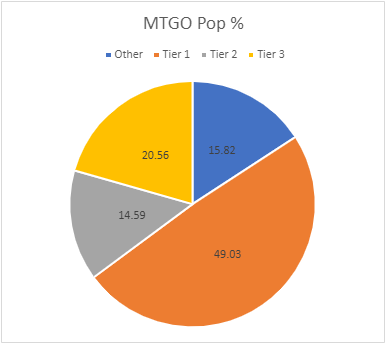
Thanks to the three outliers soaking up over a third of the total places, Tier 1 accounts of almost half of the total data in November. Interestingly, UW Control has managed to massively surge from mid-Tier 3 to Tier 1. I'd assume that it has more to do with the demise of Omnath, Locus of Creation in the wake of Yorion's ban than an independent increased interest or metagame position. Control can't really keep pace with decks where everything is a two for one or better.
The Paper Population Data
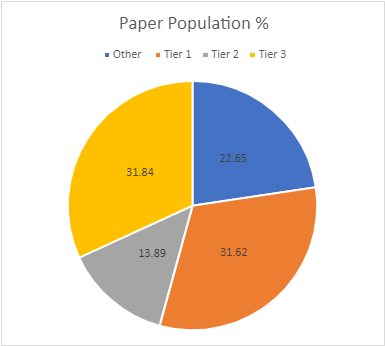
The paper tiers are calculated the same way as the MTGO tiers, just with different data. Typically, there are more paper events are reported each month, but that isn't the case in November. July had 783 decks, June had 640, and August recorded 594. September saw a surge up to 748 decks. The partial data for October had 467 decks, and November only saw 468.
Having a whole month should have produced a lot more than October, but November had confounding variables. The Regional Championships were this month and they're all Pioneer. A lot of stores switched Modern events for Pioneer to help players practice. The larger event organizers followed suit, so few and smaller events are to blame.
Weirdly, this has not affected deck diversity. October had 79 unique decks and so did November. 22 of those decks made the tier list. The average population was 5.92, so six decks make Tier 3. The STDev was 8.91, so the increment is nine. I round down if the decimal is less than .20. Again, the same as in October. Therefore, Tier 3 runs from 6 to 15, Tier 2 is 16 to 25, and Tier 1 is 26 and over.
| Deck Name | Total # | Total % |
|---|---|---|
| Tier 1 | ||
| Hammer Time | 47 | 10.04 |
| UR Murktide | 37 | 7.91 |
| 4-Color Creativity | 34 | 7.26 |
| Rakdos Scam | 30 | 6.41 |
| Tier 2 | ||
| Amulet Titan | 23 | 4.91 |
| Jeskai Breach Combo | 22 | 4.70 |
| Burn | 20 | 4.27 |
| Tier 3 | ||
| UW Control | 15 | 3.20 |
| Merfolk | 15 | 3.20 |
| Yawgmoth | 14 | 2.99 |
| Living End | 13 | 2.78 |
| Affinity | 13 | 2.78 |
| 4-Color Rhinos | 13 | 2.78 |
| Cascade Crashers | 9 | 1.92 |
| 4-Color Elementals | 9 | 1.92 |
| 5-Color Creativity | 8 | 1.71 |
| Counter Cat | 8 | 1.71 |
| Grixis Death's Shadow | 7 | 1.50 |
| Hardened Scales | 7 | 1.50 |
| Ponza | 6 | 1.28 |
| Mono-Green Tron | 6 | 1.28 |
| 4-Color Control | 6 | 1.28 |
Hammer Time is within the limit to be an outlier, despite appearances. It only started to pull away at the end of the month, when it was absurdly prevalent in an NRG event. Up until that point Murktide, Hammer, and 4-Color Creativity were basically equal.
Interestingly, both Crashing Footfalls decks made Tier 3 in November. The 4-Color version is the only one that shows up on MTGO, but both show up in paper all the time. The Temur version has shifted to being more of a Blood Moon deck than before. Whether this is paper players being more locked into decks than MTGO or a genuine metagame driven shift is unknown.
November Power Metagame
Tracking the metagame in terms of population is standard practice. But how do results actually factor in? Better decks should also have better results. In an effort to measure this, I use a power ranking system in addition to the prevalence list. By doing so, I measure the relative strengths of each deck within the metagame. The population method gives a deck that consistently just squeaks into the Top 32 the same weight as one that Top 8's. Using a power ranking rewards good results and moves the winningest decks to the top of the pile and better reflects their metagame potential.
The MTGO Power Tiers
For the MTGO data, points are awarded based on the population of the event. Preliminaries award points based on record (1 for 3 wins, 2 for 4 wins, 3 for 5), and Challenges are scored 3 points for the Top 8, 2 for Top 16, and 1 for Top 32. If I can find them, non-Wizards events will be awarded points the same as Challenges or Preliminaries depending on what the event in question reports/behaves like. Super Qualifiers and similar higher-level events get an extra point and so do other events if they’re over 200 players, with a fifth point for going over 400 players. There were a few 4-point events, but no 5-pointer in November.
Total points fell are up just like the population, from 599 to 890. The adjusted average points were 8.28, therefore nine points made Tier 3. The STDev was 9.05, which is average. Thus add 9 to the starting point and Tier 3 runs to 18 points. Tier 2 starts with 19 points and runs to 28. Tier 1 requires at least 29 points.
Total decks are the same in paper as on MTGO. However, Temur Underworld Breach fell off the list, replaced by Belcher.
| Deck Name | Total Points | Total % |
|---|---|---|
| Tier 1 | ||
| UR Murktide | 121 | 13.60 |
| Hammer Time | 91 | 10.22 |
| Rakdos Scam | 90 | 10.11 |
| UW Control | 39 | 4.38 |
| Amulet Titan | 32 | 3.60 |
| Jeskai Breach Combo | 30 | 3.37 |
| 4-Color Creativity | 29 | 3.26 |
| Yawgmoth | 29 | 3.26 |
| Tier 2 | ||
| Burn | 28 | 3.15 |
| Merfolk | 26 | 2.92 |
| 4-Color Control | 22 | 2.47 |
| Living End | 20 | 2.25 |
| Tier 3 | ||
| Counter Cat | 17 | 1.91 |
| Bring to Light | 17 | 1.91 |
| Hardened Scales | 17 | 1.91 |
| Mono-Green Tron | 15 | 1.68 |
| Mono-Red Artifacts | 13 | 1.46 |
| 5-Color Creativity | 13 | 1.46 |
| 4-Color Rhinos | 13 | 1.46 |
| Goblins | 12 | 1.35 |
| Hell's Kitchen | 12 | 1.35 |
| Grixis Death's Shadow | 11 | 1.24 |
| Mill | 11 | 1.24 |
| Calibrated Blast | 10 | 1.12 |
| Jund Saga | 9 | 1.01 |
| Belcher | 9 | 1.01 |
| UW Urza | 9 | 1.01 |

Tier 1 expanded, with Burn missing the cutoff while Jeskai Breach and Yawgmoth made it. There is a lot of movement within Tier 3, but nothing managed to escape.
It's interesting to note that the metagame has largely moved away from cascade decks in defiance of the trend earlier in the year.
The Paper Power Tiers
Unlike with population, the paper power data works differently than the equivalent MTGO data. The data reported is usually limited to the Top 8 lists, even for big events. Not that I know how big most events are, as that number doesn't always get reported.
In other cases, decks are missing. Applying the MTGO point system just doesn't work when I don't know how many points to award and there are data gaps.
Thus, I award points based on the size of the tournament rather than placement. That way I'm being internally consistent with the paper results.
The current system is that for events that don't report their starting populations or are under 50 players, I'm giving out 1 point. 51-300 players get 2 points. 301 and above get 3 points. I chose these levels based on the rarity of events over 300 compared to 100-200 and the fact that events under 300 tend to be local events in large cities. It feels like it should be 300 for truly unique events, despite there being no Grand Prix yet. I will be changing how the points are allocated next year, starting with the January metagame update.
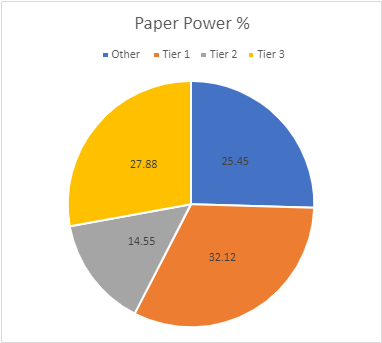
There were a huge number of events awarding 2 points in July and several 3-point events as well. Altogether November had 660 points, just up from October's 650 points, but again that's to be expected when Pioneer's the focus.
The average points were 8.35. This sets the cutoff at nine decks. The STDev was 12.93, thus adding 13 to the starting point and Tier 3 runs to 22 points. Tier 2 starts with 23 points and runs to 36. Tier 1 requires at least 37 points. The total decks fell from 22 to 19. The only deck with six instances that also had enough points to qualify was 4-Color Control.
| Deck Name | Total # | Total % |
|---|---|---|
| Tier 1 | ||
| Hammer Time | 71 | 10.76 |
| UR Murktide | 50 | 7.57 |
| Rakdos Scam | 47 | 7.12 |
| 4-Color Creativity | 44 | 6.67 |
| Tier 2 | ||
| Amulet Titan | 35 | 5.30 |
| Jeskai Breach Combo | 32 | 4.85 |
| Burn | 29 | 4.39 |
| Tier 3 | ||
| UW Control | 21 | 3.18 |
| Merfolk | 21 | 3.18 |
| 4-Color Rhinos | 21 | 3.18 |
| Yawgmoth | 19 | 2.88 |
| Living End | 19 | 2.88 |
| Affinity | 17 | 2.58 |
| Counter Cat | 14 | 2.12 |
| 4-Color Elementals | 11 | 1.67 |
| 5-Color Creativity | 11 | 1.67 |
| Grixis Death's Shadow | 11 | 1.67 |
| Cascade Crashers | 10 | 1.51 |
| 4-Color Control | 9 | 1.36 |
Big news on this front: I've come to a decision about the Omnath decks and names. The decks that run four Omanth and Solitude but few other creatures are 4-Color Control. If it has Risen Reef and noncreature spells it counts as 4-Color Elementals. If it has Reef, more elementals, and few non-creatures, that's Tribal Elementals. If there are at least three blink effects, it's 4-Color Blink. Of note, Blink has almost disappeared, and even then Ephemerate is gone, replaced by Touch the Spirit Realm.
Average Power Rankings
Finally, we come to the average power rankings. These are found by taking the total points earned and dividing them by total decks, to measure points per deck. I use this to measure strength vs. popularity. Measuring deck strength is hard. There is no Wins-Above-Replacement metric for Magic, and I'm not certain that one could be credibly devised. The game is too complex, and even then, power is very contextual.
Using the power rankings certainly helps and serves to show how justified a deck’s popularity is. However, more popular decks will still necessarily earn a lot of points. Which tracks, but also means that the top tier doesn't move much between population and power, and obscures whether they really earned their position.
This is where the averaging comes in. Decks that earn a lot of points because they get a lot of results will do worse than decks that win more events, indicating which deck actually performs better. A higher average indicates lots of high finishes, whereas low averages result from mediocre performances and a high population. Lower-tier decks typically do very well here, likely due to their pilots being enthusiasts. Bear this in mind, and be careful about reading too much into these results. However, as a general rule, decks which place above the baseline average are overperforming and vice versa.
How far above or below that average determines how "justified" a deck's position is on the power tiers. Decks well above baseline are therefore undervalued while decks well below baseline are very popular but aren't necessarily good.
The Real Story
When considering the average points, the key is looking at how far-off a deck is from the Baseline stat (the overall average of points/population). The closer a deck’s performance to the Baseline, the more likely it is to be performing close to its “true” potential. A deck that is exactly average would therefore perform exactly as well as expected. The greater the deviation from the average, the more a deck under or over-performs. On the low end, a deck’s placing was mainly due to population rather than power, which suggests it’s overrated. A high-scoring deck is the opposite of this.
I'll begin with the averages for MTGO:
| Deck Name | Average Points | Power Tier |
|---|---|---|
| Belcher | 3.00 | 3 |
| Hell's Kitchen | 2.00 | 3 |
| Mono-Green Tron | 1.87 | 3 |
| Merfolk | 1.86 | 2 |
| Rakdos Scam | 1.84 | 1 |
| Mill | 1.83 | 3 |
| Goblins | 1.71 | 3 |
| Bring to Light | 1.70 | 3 |
| Hardened Scales | 1.70 | 3 |
| UW Control | 1.62 | 1 |
| Mono-Red Artifacts | 1.62 | 3 |
| 5-Color Creativity | 1.62 | 3 |
| 4-Color Rhinos | 1.62 | 3 |
| Jeskai Breach Combo | 1.58 | 1 |
| Baseline | 1.58 | |
| UR Murktide | 1.53 | 1 |
| Yawgmoth | 1.53 | 1 |
| UW Urza | 1.50 | 3 |
| Hammer Time | 1.47 | 1 |
| 4-Color Creativity | 1.45 | 1 |
| Calibrated Blast | 1.43 | 3 |
| Counter Cat | 1.42 | 3 |
| Burn | 1.40 | 2 |
| 4-Color Control | 1.37 | 2 |
| Grixis Death's Shadow | 1.37 | 3 |
| Living End | 1.33 | 2 |
| Jund Saga | 1.29 | 3 |
| Amulet Titan | 1.28 | 1 |
Congratulations to Rakdos Scam for being the best performing Tier 1 deck on MTGO. You're deck of the month, though we all suspect you cheated. Meanwhile, Amulet Titan, get your act together. No Tier 1 deck has ever been at the bottom of these rankings before. Put some effort into winning or just accept Tier 3 status.
Now, the averages for paper:
| Deck Name | Average Points | Power Tier |
|---|---|---|
| Counter Cat | 1.75 | 3 |
| 4-Color Rhinos | 1.61 | 3 |
| Rakdos Scam | 1.57 | 1 |
| Grixis Death's Shadow | 1.57 | 3 |
| Amulet Titan | 1.52 | 2 |
| Hammer Time | 1.51 | 1 |
| 4-Color Control | 1.50 | 3 |
| Living End | 1.46 | 3 |
| Jeskai Breach Combo | 1.45 | 2 |
| Burn | 1.45 | 2 |
| UW Control | 1.40 | 3 |
| Merfolk | 1.40 | 3 |
| Baseline | 1.38 | |
| 5-Color Creativity | 1.37 | 3 |
| Yawgmoth | 1.36 | 3 |
| UR Murktide | 1.35 | 1 |
| Affinity | 1.31 | 3 |
| 4-Color Creativity | 1.29 | 1 |
| 4-Color Elementals | 1.22 | 3 |
| Cascade Crashers | 1.11 | 3 |
And Scam sweeps both categories. Check the judge's bank accounts; surely there must be some bribery involved.
Composite Metagame
That's a lot of data, but what does it all mean? When Modern Nexus first started, we had a statistical method to combine the MTGO and paper data, but the math of that system doesn't work without big paper events. I tried. Instead, I'm using an averaging system to combine the data. I take the MTGO results and average the tier, then separately average the paper results, then average the paper and MTGO results together for final tier placement.
This generates a lot of partial Tiers. That's not a bug, it's a feature. The nuance separates the solidly Tiered decks from the more flexible ones and shows the true relative power differences between the decks. Every deck in the paper and MTGO results is on the table, and when they don't appear in a given category, they're marked N/A. This is treated as a 4 for averaging purposes.
| Deck Name | MTGO Pop. Tier | MTGO Power Tier | MTGO Average Tier | Paper Pop. Tier | Paper Power Tier | Paper Average Tier | Composite Tier |
|---|---|---|---|---|---|---|---|
| Rakdos Scam | 1 | 1 | 1.00 | 1 | 1 | 1.00 | 1.00 |
| UR Murktide | 1 | 1 | 1.00 | 1 | 1 | 1.00 | 1.00 |
| Hammer Time | 1 | 1 | 1.00 | 1 | 1 | 1.00 | 1.00 |
| 4-Color Creativity | 1 | 1 | 1.00 | 1 | 1 | 1.00 | 1.00 |
| Amulet Titan | 1 | 1 | 1.00 | 2 | 2 | 2.00 | 1.50 |
| Jeskai Breach Combo | 2 | 1 | 1.50 | 2 | 2 | 2.00 | 1.75 |
| Burn | 1 | 2 | 1.50 | 2 | 2 | 2.00 | 1.75 |
| UW Control | 1 | 1 | 1.00 | 3 | 3 | 3.00 | 2.00 |
| Yawgmoth | 2 | 1 | 1.50 | 3 | 3 | 3.00 | 2.25 |
| Merfolk | 2 | 2 | 2.00 | 3 | 3 | 3.00 | 2.50 |
| 4-Color Control | 2 | 2 | 2.00 | 3 | 3 | 3.00 | 2.50 |
| Living End | 2 | 2 | 2.00 | 3 | 3 | 3.00 | 2.50 |
| 5-Color Creativity | 3 | 3 | 3.00 | 3 | 3 | 3.00 | 3.00 |
| 4-Color Rhinos | 3 | 3 | 3.00 | 3 | 3 | 3.00 | 3.00 |
| Counter Cat | 3 | 3 | 3.00 | 3 | 3 | 3.00 | 3.00 |
| Grixis Death's Shadow | 3 | 3 | 3.00 | 3 | 3 | 3.00 | 3.00 |
| Mono-Green Tron | 3 | 3 | 3.00 | 3 | N/A | 3.50 | 3.25 |
| Hardened Scales | 3 | 3 | 3.00 | 3 | N/A | 3.50 | 3.25 |
| Hell's Kitchen | 3 | 3 | 3.00 | N/A | N/A | N/A | 3.50 |
| Mill | 3 | 3 | 3.00 | N/A | N/A | N/A | 3.50 |
| Goblins | 3 | 3 | 3.00 | N/A | N/A | N/A | 3.50 |
| Bring to Light | 3 | 3 | 3.00 | N/A | N/A | N/A | 3.50 |
| Mono-Red Artifacts | 3 | 3 | 3.00 | N/A | N/A | N/A | 3.50 |
| UW Urza | 3 | 3 | 3.00 | N/A | N/A | N/A | 3.50 |
| Calibrated Blast | 3 | 3 | 3.00 | N/A | N/A | N/A | 3.50 |
| Jund Saga | 3 | 3 | 3.00 | N/A | N/A | N/A | 3.50 |
| Cascade Crashers | N/A | N/A | N/A | 3 | 3 | 3.00 | 3.50 |
| Affinity | N/A | N/A | N/A | 3 | 3 | 3.00 | 3.50 |
| 4-Color Elementals | N/A | N/A | N/A | 3 | 3 | 3.00 | 3.50 |
| Temur Breach | 3 | N/A | 3.50 | N/A | N/A | N/A | 3.75 |
| Belcher | N/A | 3 | 3.50 | N/A | N/A | N/A | 3.75 |
| Ponza | N/A | N/A | N/A | 3 | N/A | 3.50 | 3.75 |
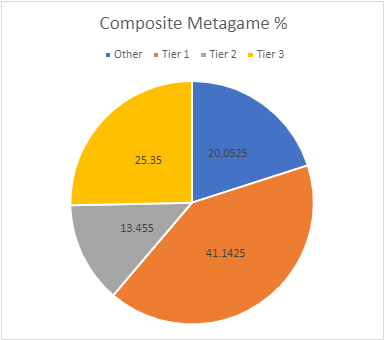
Thanks to MTGO's ridiculous number of outliers holding their thumbs on the scale, Tier 1 represented an inordinate percentage of the overall Modern metagame in November. If this continues, it will mostly likely be bad times.
Dynamic Stability
November was very much a continuation of the trends first seen in October. I'd expect that to continue in December, when Magic traditionally takes a breather and events are down. Come 2023, the conclusion of the current Phyrexian storyline will have consequences. Hopefully, not dire, but we'll all see.
