Are you a Quiet Speculation member?
If not, now is a perfect time to join up! Our powerful tools, breaking-news analysis, and exclusive Discord channel will make sure you stay up to date and ahead of the curve.
It has been a year since Modern was redefined by Lurrus of the Dream-Den's banning. Modern was skipped over in the latest banning announcement. Thus, it is more important than ever to be tuned into the metagame. And it just so happens to be Metagame Update Day. Rejoice!
A Year of Outliers
A year and a day ago, Lurrus was banned. This kicked off the domination of Modern by UR Murktide, during which time it has never not been an outlier on Magic Online (MTGO) and usually in paper too. February 2023 is no exception, and with that the circle closes. 12 months of Murktide as a statistical outlier, and in both paper and MTGO.
Murktide is paper's only outlier, but is joined on MTGO by Rakdos Scam. Those two decks accounted for just under 25% of the metagame. Just two decks; a quarter of the visable metagame online. This is a sharp contrast to what Wizards said in their ban announcement, and I quote:
Izzet Murktide is currently the most popular archetype in competitive play, but not by a large margin, and the deck isn't showing a concerning win rate.
The second sentence of their Modern explanation. Underlined for emphasis.
Either Wizards has a very different definition of "large margin" than I do or Murktide doesn't show up in League play, bringing the overall percentage gap down substantially. There's really no other way that the 6.84% gap between Murktide's and Scam's population numbers aren't a statistically large margin. Yes, I am calling them out on this possible deflection.
Hammer Time didn't qualify as an outlier online comfortably, though paper is another story. It was literally on the line according to multiple tests to be considered an outlier, with one test putting the outlier line at 58.5 and another at 59. Hammer therefore isn't an outlier this time, but know that it is as close as possible.
As always, outliers are removed from the data analysis. They're in their correct position on the tables.
February Population Metagame
To make the tier list, a given deck has to beat the overall average population for the month. The average is my estimate for how many results a given deck "should” produce in a given month. Being a tiered deck requires being better than “good enough.” Every deck that posts at least the average number of results is "good enough" and makes the tier list.
Then we go one standard deviation (STdev) above average to set the limit of Tier 3 and the cutoff for Tier 2. This mathematically defines Tier 3 as those decks clustered near the average. Tier 2 goes from the cutoff to the next standard deviation. These are decks that perform well above average. Tier 1 consists of those decks at least two standard deviations above the mean result, encompassing the truly exceptional performing decks.
The MTGO data nearly exclusively comes from official Preliminary and Challenge results. Leagues are excluded, as they're a curated list and thus invalid. The paper data comes from any source I can find, with all reported events being counted.
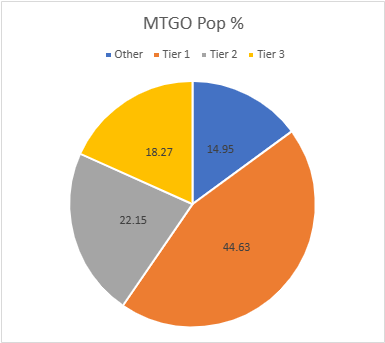
The MTGO Population Data
In December, the adjusted average population for MTGO was 8.02, setting the Tier 3 cutoff at eight decks. I always round down if the decimal is smaller than .20. Tier 3, therefore, begins with decks posting eight results. The adjusted STdev was 11.46, which means that Tier 3 runs to 20 results. Again, it's the starting point to the cutoff, then the next whole number for the next Tier. Therefore Tier 2 starts with 21 results and runs to 33. Subsequently, to make Tier 1, 34 decks are required. This is just slightly above average.
February is the largest combined data set I've ever analyzed for this series. I have no idea why, but there were far more events with large populations on MTGO coupled with a large amount of paper events. January 2023 had 840 decks, while February had 876. I'm not complaining, but ever since Wizards farmed MTGO out to Daybreak games, I've been rolling in data.
A much higher population also means more unique decks. January had 74 unique decks, while February had 84. Of those 84 decks, 25 made the population tier. Which is down from January's 27 decks, and the fact that this has happened with more total decks is worrying.
| Deck Name | Total # | Total % |
|---|---|---|
| Tier 1 | ||
| UR Murktide | 139 | 15.87 |
| Rakdos Scam | 79 | 9.02 |
| Hammer Time | 58 | 6.62 |
| 4-Color Creativity | 43 | 4.91 |
| Burn | 36 | 4.11 |
| Yawgmoth | 36 | 4.11 |
| Tier 2 | ||
| Amulet Titan | 32 | 3.65 |
| Mill | 32 | 3.65 |
| Cascade Crashers | 27 | 3.08 |
| 4-Color Elementals | 27 | 3.08 |
| Izzet Prowess | 27 | 3.08 |
| Living End | 25 | 2.85 |
| Jeskai Value Breach | 24 | 2.74 |
| Tier 3 | ||
| Temur Creativity | 19 | 2.17 |
| UW Control | 18 | 2.05 |
| 4-Color Rhinos | 16 | 1.83 |
| Mono-Red Artifacts | 14 | 1.60 |
| Mono-Green Tron | 14 | 1.60 |
| Mono-Red Moon | 14 | 1.60 |
| Merfolk | 12 | 1.37 |
| 4-Color Blink | 12 | 1.37 |
| Bring to Light | 11 | 1.26 |
| Counter Cat | 11 | 1.26 |
| Humans | 10 | 1.14 |
| 5-Color Creativity | 9 | 1.03 |
I suspect Hammer's decline online is down to Mill's ascendancy. Tasha's Hideous Laughter absolutely rinses a mana curve as low as Hammer's. That's true for Amulet Titan too, but I'm told The Mycosynth Gardens speeds up the deck enough to race Mill more often.
Not for the first time, Indomitable Creativity players have moved towards a single champion, and once again its 4-Color rather than true 5-Color, Jund, or Temur variants. That is always a bit deceptive as 4-Color is a big tent of variation, but color discipline doesn't seem to be a concern. The side effect is that overall Creativity numbers are down this month.
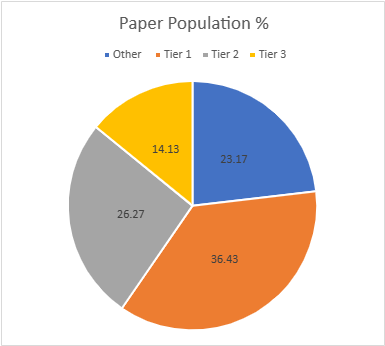
The Paper Population Data
The paper tiers are calculated the same way as the MTGO tiers, just with different data. In most months there are far more reported paper events than online, but paper also tends to report fewer results per event. It's quite annoying, but paper events rarely report more than the Top 8, and far too often for my purposes, the Top 4. This makes the paper data far more variable than MTGO. January saw 667 decks, while February is up to 807. As previously mentioned, this is the largest combined data set I've worked with, but paper is just naturally this variable.
With significantly more decks recorded come more distinct decks. January had 101 and February is up to 108. 23 decks made the tier list, which is seems low but is pretty typical for paper. There are scads of singleton decks every month. The adjusted average population was 7.37, so eight decks make Tier 3. The STDev was 11.08, so the increment is 12. Therefore, Tier 3 runs from 8 to 20, Tier 2 is 21 to 33, and Tier 1 is 34 and over. Exactly the same as MTGO, weirdly and coincidentally.
| Deck Name | Total # | Total % |
|---|---|---|
| Tier 1 | ||
| UR Murktide | 85 | 10.53 |
| Hammer Time | 59 | 7.31 |
| Rakdos Scam | 56 | 6.94 |
| Amulet Titan | 52 | 6.44 |
| 4-Color Creativity | 42 | 5.20 |
| Tier 2 | ||
| Cascade Crashers | 33 | 4.09 |
| Burn | 29 | 3.59 |
| Merfolk | 27 | 3.35 |
| Yawgmoth | 27 | 3.35 |
| UW Control | 26 | 3.22 |
| Jeskai Value Breach | 25 | 3.10 |
| 4-Color Elementals | 24 | 2.97 |
| 4-Color Rhinos | 21 | 2.60 |
| Tier 3 | ||
| Living End | 15 | 1.86 |
| Mill | 15 | 1.86 |
| Affinity | 13 | 1.61 |
| Izzet Prowess | 13 | 1.61 |
| Counters Stoneblade | 11 | 1.36 |
| Grixis Shadow | 11 | 1.36 |
| Domain Zoo | 10 | 1.24 |
| Mono-Green Tron | 9 | 1.11 |
| Jund Saga | 9 | 1.11 |
| Hardened Scales | 8 | 0.99 |
Interestingly, due to the large gaps between the tiers, it didn't matter if I removed the outlier or not. The same decks would have made the list with unadjusted statistics and only 4-Color Rhinos would have changed tiers. However, I have a system, and I'm sticking to it.
Amulet Titan got a big boost in February thanks to Star City Games. I don't know why, but Titan has always been much more popular at their events than elsewhere. The Modern events in Indianapolis were positively swimming in Titans and boosted the deck from mid-Tier 2 to Tier 1.
The Mono-Red Artifacts deck showed up in paper exactly once all February. I speculated last month that it was a deck specific to the MTGO metagame, and that appears to be the case. Why this is the case makes no sense to me, but sometime it do just be that way. Perhaps March will be different.
December Power Metagame
Tracking the metagame in terms of population is standard practice. But how do results actually factor in? Better decks should also have better results. In an effort to measure this, I use a power ranking system in addition to the prevalence list. By doing so, I measure the relative strengths of each deck within the metagame.
The population method gives a deck that consistently just squeaks into the Top 32 the same weight as one that Top 8's. Using a power ranking rewards good results and moves the winningest decks to the top of the pile and better reflects their metagame potential.
The MTGO Power Tiers
For the MTGO data, points are awarded based on the population of the event. Preliminaries award points based on record (1 for 3 wins, 2 for 4 wins, 3 for 5), and Challenges are scored 3 points for the Top 8, 2 for Top 16, and 1 for Top 32. If I can find them, non-Wizards events will be awarded points the same as Challenges or Preliminaries depending on what the event in question reports/behaves like. Super Qualifiers and similar higher-level events get an extra point and so do other events if they’re over 200 players, with a fifth point for going over 400 players. There were a few 4-point events and no 5-pointer in February.
Total points rose just like the population, from 1321 to 1412. The adjusted average points were 13.14, therefore 13 points made Tier 3. The STDev was 19.09, which is a fairly high. Thus add 19 to the starting point and Tier 3 runs to 32 points. Tier 2 starts with 33 points and runs to 52. Tier 1 requires at least 53 points.
All the decks from the population tier made the power tier, and no new decks made it in. A number of decks jumped tier and many moved within their tiers, so it's not an identical list.
| Deck Name | Total Points | Total % |
|---|---|---|
| Tier 1 | ||
| UR Murktide | 216 | 15.30 |
| Rakdos Scam | 118 | 8.36 |
| Hammer Time | 92 | 6.55 |
| 4-Color Creativity | 67 | 4.75 |
| Yawgmoth | 66 | 4.67 |
| Amulet Titan | 57 | 4.04 |
| Burn | 54 | 3.82 |
| Mill | 54 | 3.82 |
| Cascade Crashers | 53 | 3.75 |
| Tier 2 | ||
| 4-Color Elementals | 47 | 3.33 |
| Izzet Prowess | 47 | 3.33 |
| Jeskai Value Breach | 42 | 2.97 |
| Living End | 37 | 2.62 |
| Temur Creativity | 32 | 2.27 |
| Tier 3 | ||
| UW Control | 28 | 1.98 |
| 4-Color Rhinos | 27 | 1.91 |
| Mono-Red Moon | 26 | 1.84 |
| Mono-Red Artifacts | 24 | 1.70 |
| Mono-Green Tron | 23 | 1.63 |
| Merfolk | 18 | 1.27 |
| Humans | 18 | 1.27 |
| Counter Cat | 14 | 0.99 |
| 4-Color Blink | 13 | 0.92 |
| Bring to Light | 13 | 0.92 |
| 5-Color Creativity | 13 | 0.92 |
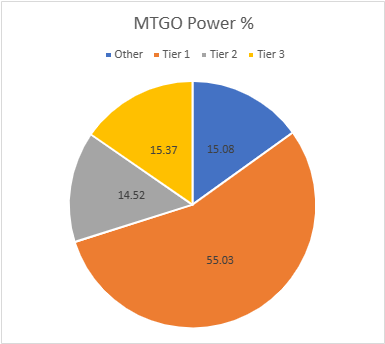
Somehow, while more points were concentrated in Tier 1 than population, it is slightly better spread out. Murktide and Scam only account for 23.66% of the overall results. Little victories and silver linings.
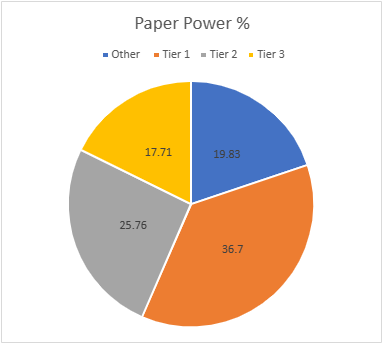
The Paper Power Tiers
Due to paper reporting being inconsistent compared to MTGO, I have to adapt how the points work. Applying the MTGO point system just doesn't work when I don't know how many points to award and there are data gaps. Thus, I award points based on the size of the tournament rather than placement. That way I'm being internally consistent with the paper results.
For events with no reported starting population and those up to 32 players, one point is awarded. Events with 33 players up to 128 players gets two points. From 129 players up to 512 players gets three. Above 512 is four points and five points will be reserved for Modern Pro Tours if they ever happen.
No event hit the four-point threshold in February, but there were tons of two-point events. January saw 1178 and February hit 1316. The adjusted average points were 11.96. This sets the cutoff at 12 decks. The STDev was 19.37, thus adding 20 to the starting point and Tier 3 runs to 32 points. Tier 2 starts with 33 points and runs to 53. Tier 1 requires at least 54 points. The total decks rose from 23 to 27. No deck fell off from the population tier and the bottom four decks all squeaked in.
| Deck Name | Total Points | Total % |
|---|---|---|
| Tier 1 | ||
| UR Murktide | 139 | 10.56 |
| Hammer Time | 102 | 7.75 |
| Rakdos Scam | 88 | 6.69 |
| Amulet Titan | 87 | 6.61 |
| 4-Color Creativity | 67 | 5.09 |
| Tier 2 | ||
| Burn | 52 | 3.95 |
| Cascade Crashers | 50 | 3.80 |
| Yawgmoth | 45 | 3.42 |
| Jeskai Value Breach | 44 | 3.34 |
| UW Control | 43 | 3.27 |
| 4-Color Rhinos | 36 | 2.74 |
| Merfolk | 35 | 2.66 |
| 4-Color Elementals | 34 | 2.58 |
| Tier 3 | ||
| Mill | 25 | 1.90 |
| Affinity | 23 | 1.75 |
| Living End | 22 | 1.67 |
| Izzet Prowess | 21 | 1.60 |
| Jund Saga | 18 | 1.37 |
| Domain Zoo | 17 | 1.29 |
| Hardened Scales | 15 | 1.14 |
| Counters Stoneblade | 14 | 1.06 |
| Grixis Shadow | 14 | 1.06 |
| Mono-Green Tron | 14 | 1.06 |
| Counter Cat | 13 | 0.99 |
| Hell's Kitchen | 13 | 0.99 |
| Temur Combo Breach | 12 | 0.91 |
| Jeskai Combo Breach | 12 | 0.91 |
A quirk of larger data sets is that the lower bound tends to represent far less of the total percentage-wise. It'd be unheard of last year for decks with less than 1% representation to make the tier list, but that's exactly what's happening now. Really long tails will do that to data.
Average Power Rankings
Finally, we come to the average power rankings. These are found by taking the total points earned and dividing them by total decks, to measure points per deck. I use this to measure strength vs. popularity. Measuring deck strength is hard. There is no Wins-Above-Replacement metric for Magic, and I'm not certain that one could be credibly devised. The game is too complex, and even then, power is very contextual.
Using the power rankings certainly helps and serves to show how justified a deck’s popularity is. However, more popular decks will still necessarily earn a lot of points. Which tracks, but also means that the top tier doesn't move much between population and power, and obscures whether they really earned their position.
This is where the averaging comes in. Decks that earn a lot of points because they get a lot of results will do worse than decks that win more events, indicating which deck actually performs better. A higher average indicates lots of high finishes, whereas low averages result from mediocre performances and a high population. Lower-tier decks typically do very well here, likely due to their pilots being enthusiasts. Bear this in mind, and be careful about reading too much into these results. However, as a general rule, decks which place above the baseline average are overperforming and vice versa.
How far above or below that average determines how "justified" a deck's position is on the power tiers. Decks well above baseline are therefore undervalued while decks well below baseline are very popular but aren't necessarily good.
The Real Story
When considering the average points, the key is looking at how far-off a deck is from the Baseline stat (the overall average of points/population). The closer a deck’s performance to the Baseline, the more likely it is to be performing close to its “true” potential. A deck that is exactly average would therefore perform exactly as well as expected. The greater the deviation from the average, the more a deck under or over-performs. On the low end, a deck’s placing was mainly due to population rather than power, which suggests it’s overrated. A high-scoring deck is the opposite of this.
I'll begin with the averages for MTGO:
| Deck Name | Average Points | Power Tier |
|---|---|---|
| Cascade Crashers | 1.96 | 1 |
| Mono-Red Moon | 1.86 | 3 |
| Yawgmoth | 1.83 | 1 |
| Humans | 1.80 | 3 |
| Amulet Titan | 1.78 | 1 |
| Jeskai Value Breach | 1.75 | 2 |
| 4-Color Elementals | 1.74 | 2 |
| Izzet Prowess | 1.74 | 2 |
| Mono-Red Artifacts | 1.71 | 3 |
| Mill | 1.69 | 1 |
| 4-Color Rhinos | 1.69 | 3 |
| Temur Creativity | 1.68 | 2 |
| Mono-Green Tron | 1.64 | 3 |
| Baseline | 1.60 | |
| Hammer Time | 1.59 | 1 |
| 4-Color Creativity | 1.56 | 1 |
| UR Murktide | 1.55 | 1 |
| UW Control | 1.55 | 3 |
| Burn | 1.50 | 1 |
| Merfolk | 1.50 | 3 |
| Rakdos Scam | 1.49 | 1 |
| Living End | 1.48 | 2 |
| 5-Color Creativity | 1.44 | 3 |
| Counter Cat | 1.27 | 3 |
| Bring to Light | 1.18 | 3 |
| 4-Color Blink | 1.08 | 3 |
Surprisingly well done, Cascade Crashers. You snuck up to Tier 1 on power and then blew every other deck away with your performance. Bravo, you were the MTGO Deck of February.
Now the paper averages:
| Deck Name | Average Points | Power Tier |
|---|---|---|
| Hell's Kitchen | 2.17 | 3 |
| Jund Saga | 2.00 | 3 |
| Jeskai Combo Breach | 2.00 | 3 |
| Hardened Scales | 1.88 | 3 |
| Counter Cat | 1.86 | 3 |
| Burn | 1.79 | 2 |
| Affinity | 1.77 | 3 |
| Jeskai Value Breach | 1.76 | 2 |
| Hammer Time | 1.73 | 1 |
| 4-Color Rhinos | 1.71 | 2 |
| Temur Combo Breach | 1.71 | 3 |
| Domain Zoo | 1.70 | 3 |
| Amulet Titan | 1.67 | 1 |
| Yawgmoth | 1.67 | 2 |
| Mill | 1.67 | 3 |
| UW Control | 1.65 | 2 |
| UR Murktide | 1.63 | 1 |
| Izzet Prowess | 1.61 | 3 |
| Baseline | 1.60 | |
| 4-Color Creativity | 1.59 | 1 |
| Rakdos Scam | 1.57 | 1 |
| Mono-Green Tron | 1.55 | 3 |
| Cascade Crashers | 1.51 | 2 |
| Living End | 1.47 | 3 |
| 4-Color Elementals | 1.42 | 2 |
| Merfolk | 1.30 | 2 |
| Counters Stoneblade | 1.27 | 3 |
| Grixis Shadow | 1.27 | 3 |
Hammer Time may not have been an outlier, but it did outperform all the other Tier 1 decks in paper, so it's officially the Deck of the Month.
Composite Metagame
That's a lot of data, but what does it all mean? When Modern Nexus first started, we had a statistical method to combine the MTGO and paper data, but the math of that system doesn't work without big paper events. I tried. Instead, I'm using an averaging system to combine the data. I take the MTGO results and average the tier, then separately average the paper results, then average the paper and MTGO results together for final tier placement.
This generates a lot of partial Tiers. That's not a bug, but a feature. The nuance separates the solidly Tiered decks from the more flexible ones and shows the true relative power differences between the decks. Every deck in the paper and MTGO results is on the table, and when they don't appear in a given category, they're marked N/A. This is treated as a 4 for averaging purposes.
| Deck Name | MTGO Population Tier | MTGO Power Tier | MTGO Average Tier | Paper Population Tier | Paper Power Tier | Paper Average Tier | Composite Tier |
|---|---|---|---|---|---|---|---|
| UR Murktide | 1 | 1 | 1 | 1 | 1 | 1 | 1 |
| Rakdos Scam | 1 | 1 | 1 | 1 | 1 | 1 | 1 |
| Hammer Time | 1 | 1 | 1 | 1 | 1 | 1 | 1 |
| 4-Color Creativity | 1 | 1 | 1 | 1 | 1 | 1 | 1 |
| Amulet Titan | 2 | 1 | 1.5 | 1 | 1 | 1 | 1.25 |
| Burn | 1 | 1 | 1 | 2 | 2 | 2 | 1.5 |
| Yawgmoth | 1 | 1 | 1 | 2 | 2 | 2 | 1.5 |
| Cascade Crashers | 2 | 1 | 1.5 | 2 | 2 | 2 | 1.75 |
| 4-Color Elementals | 2 | 2 | 2 | 2 | 2 | 2 | 2 |
| Jeskai Value Breach | 2 | 2 | 2 | 2 | 2 | 2 | 2 |
| Mill | 2 | 1 | 1.5 | 3 | 3 | 3 | 2.25 |
| Izzet Prowess | 2 | 2 | 2 | 3 | 3 | 3 | 2.5 |
| Living End | 2 | 2 | 2 | 3 | 3 | 3 | 2.5 |
| UW Control | 3 | 3 | 3 | 2 | 2 | 2 | 2.5 |
| 4-Color Rhinos | 3 | 3 | 3 | 2 | 2 | 2 | 2.5 |
| Merfolk | 3 | 3 | 3 | 2 | 2 | 2 | 2.5 |
| Mono-Green Tron | 3 | 3 | 3 | 3 | 3 | 3 | 3 |
| Temur Creativity | 3 | 2 | 2.5 | N/A | N/A | N/A | 3.25 |
| Counter Cat | 3 | 3 | 3 | N/A | 3 | 3.5 | 3.25 |
| Mono-Red Artifacts | 3 | 3 | 3 | N/A | N/A | N/A | 3.5 |
| Mono-Red Moon | 3 | 3 | 3 | N/A | N/A | N/A | 3.5 |
| 4-Color Blink | 3 | 3 | 3 | N/A | N/A | N/A | 3.5 |
| Bring to Light | 3 | 3 | 3 | N/A | N/A | N/A | 3.5 |
| Humans | 3 | 3 | 3 | N/A | N/A | N/A | 3.5 |
| 5-Color Creativity | 3 | 3 | 3 | N/A | N/A | N/A | 3.5 |
| Affinity | N/A | N/A | N/A | 3 | 3 | 3 | 3.5 |
| Counters Stoneblade | N/A | N/A | N/A | 3 | 3 | 3 | 3.5 |
| Grixis Shadow | N/A | N/A | N/A | 3 | 3 | 3 | 3.5 |
| Domain Zoo | N/A | N/A | N/A | 3 | 3 | 3 | 3.5 |
| Jund Saga | N/A | N/A | N/A | 3 | 3 | 3 | 3.5 |
| Hardened Scales | N/A | N/A | N/A | 3 | 3 | 3 | 3.5 |
| Hell's Kitchen | N/A | N/A | N/A | N/A | 3 | 3.5 | 3.75 |
| Temur Combo Breach | N/A | N/A | N/A | N/A | 3 | 3.5 | 3.75 |
| Jeskai Combo Creach | N/A | N/A | N/A | N/A | 3 | 3.5 | 3.75 |
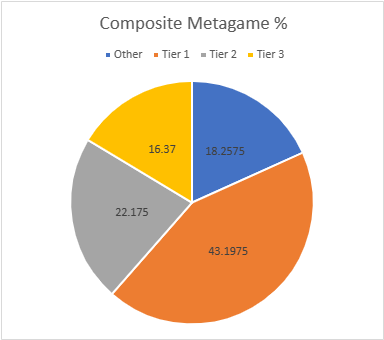
To no one's surprise, the four fully Tier 1 decks are Murktide, Scam, Hammer Time, and newcomer 4-Color Creativity.
Modern Unchanging
The top tier is pretty well set at this point, and Wizards isn't in a hurry to change anything. There remains room to maneuver and explore in the lower tiers, but I don't think anything is going to seriously challenge the Big Three. Unless the Rakdos players all switch up their decks for no discernable reason. I'll wait and see.
