Are you a Quiet Speculation member?
If not, now is a perfect time to join up! Our powerful tools, breaking-news analysis, and exclusive Discord channel will make sure you stay up to date and ahead of the curve.
Welcome to the first Modern Metagame Update of the new year. It's... not going to feel that different from all the previous ones, if I'm honest. Modern has some exciting stuff happening within itself, but it isn't translating into a shakeup. The decks that have been on top for the past year will continue to be on top for the immediate future. The longer-term picture is far muddier, as we don't know exactly how Phyrexia: All Will Be One will impact Modern.
Wild World of Outliers
As has become the norm, the data is affected by statistical outliers. However, this is a weird month as far as they go. Both paper and Magic Online (MTGO) are impacted, but the effects are very different and will be treated accordingly.
In paper, UR Murktide is a statistical outlier by most normal tests. However, I left it in the data rather than remove it as I normally would. This is because the paper data is far from normally distributed and removing the outlier made the skew worse. For the statistically literate, the first three quartiles only included the decks with one to four results. Without Murktide in the data, Tier 3 was only four decks, Tier 1 was three, and the rest were in Tier 2. That's... not right, so I didn't remove Murktide from the data.
As for MTGO, the outliers were very severe. Both Murktide and Hammer Time are outliers with more than double the numbers of their closest competitor, Rakdos Scam. Scam in turn was a borderline outlier above fourth place UW Control. Had I left Murktide and Hammer in the data, they would be the only decks in Tier 1, only Scam and Control would have been in Tier 2, and everything else is Tier 3. That's also not right, so Murktide and Hammer were removed. Removing Scam had no effect on the stats, so it stays.
As always, outliers are in their correct place on the metagame chart, but are excluded from the actual calculations, resulting in an adjusted average and standard deviation.
December Population Metagame
To make the tier list, a given deck has to beat the overall average population for the month. The average is my estimate for how many results a given deck "should” produce in a given month. Being a tiered deck requires being better than “good enough.” Every deck that posts at least the average number of results is "good enough" and makes the tier list.
Then we go one standard deviation (STdev) above average to set the limit of Tier 3 and the cutoff for Tier 2. This mathematically defines Tier 3 as those decks clustered near the average. Tier 2 goes from the cutoff to the next standard deviation. These are decks that perform well above average. Tier 1 consists of those decks at least two standard deviations above the mean result, encompassing the truly exceptional performing decks.
The MTGO data nearly exclusively comes from official Preliminary and Challenge results. Leagues are excluded, as they're a curated list and thus invalid. The paper data comes from any source I can find, with all reported events being counted.
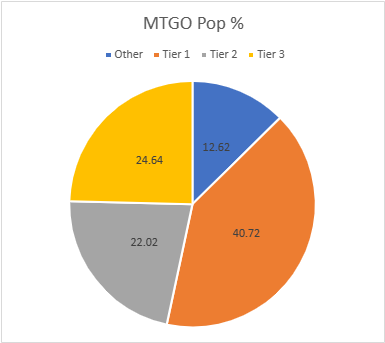
The MTGO Population Data
In December, the adjusted average population for MTGO was 8.65, setting the Tier 3 cutoff at nine decks. Even with the outliers removed, this is a high average, but there's a good reason for it that I'll explain shortly. Tier 3, therefore, begins with decks posting nine results. The adjusted STdev was 10.74, which means that Tier 3 runs to 20 results. Again, it's the starting point to the cutoff, then the next whole number for the next Tier. Therefore Tier 2 starts with 21 results and runs to 32. Subsequently, to make Tier 1, 33 decks are required. As with the STdev, these numbers are slightly up from previous months.
January is always a high point in terms of MTGO participation. I have no idea why, but that's been the case for the past few years and 2023 is no exception. However, this January's size is truly exceptional. January 2022 mustered just 502 total decks while January 2023 has 840. This is partially thanks to many large Preliminaries but also thanks to Daybreak adding more Challenges to the schedule. More events mean more data.
A much higher population also means more unique decks. December had 57 decks while January has 74, the same as November. That's actually rather concerning, as November did that with 569 decks. Significantly more decks in the population should yield more uniqueness than it did, which is a bad sign. Of those 74 decks, 27 made the population tier. That's a solid turnout, but again seems low given the starting population.
| Deck Name | Total # | Total % |
|---|---|---|
| Tier 1 | ||
| UR Murtktide | 118 | 14.05 |
| Hammer Time | 101 | 12.02 |
| Rackdos Scam | 49 | 5.83 |
| UW Control | 37 | 4.40 |
| Yawgmoth | 37 | 4.40 |
| Tier 2 | ||
| Cascade Crashers | 32 | 3.81 |
| Jeskai Value Breach | 30 | 3.57 |
| Amulet Titan | 29 | 3.45 |
| Mono-Green Tron | 25 | 2.98 |
| Temur Creativity | 24 | 2.86 |
| Living End | 23 | 2.74 |
| 4-Color Creativity | 22 | 2.61 |
| Tier 3 | ||
| Mono-Red Artifacts | 20 | 2.38 |
| Jund Creativity | 20 | 2.38 |
| Burn | 19 | 2.26 |
| Grixis Shadow | 17 | 2.02 |
| 4-Color Control | 16 | 1.90 |
| Jeskai Storm Breach | 15 | 1.79 |
| Jeskai Combo Breach | 13 | 1.55 |
| Izzet Prowess | 13 | 1.55 |
| Merfolk | 12 | 1.43 |
| 4-Color Rhinos | 12 | 1.43 |
| Counter Cat | 12 | 1.43 |
| Mill | 10 | 1.19 |
| Tribal Elementals | 10 | 1.19 |
| Dredge | 9 | 1.07 |
| Jund Saga | 9 | 1.07 |
Notice the enormous gap I mentioned earlier? There's clear bias in the metagame, and it's crowding out alternative decks. It's been nearly a year since this first started, and it will take a seismic shift to change anything. That is not to say that innovation is impossible, just that cracking the top tiers may be out of reach.
The deck I'm calling Mono-Red Artifacts but doesn't have an established name yet is certainly trying to change things. Almost an upscaled Pauper deck, the premise of this deck is to launch the typical Burn/Prowess cheap creature attack and then finish the game with Shrapnel Blast. It exploded out of the gates in January, going from non-existent to nearly Tier 2. This is a deck to watch.
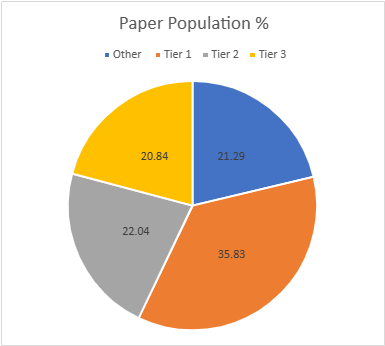
The Paper Population Data
The paper tiers are calculated the same way as the MTGO tiers, just with different data. In most months there are far more reported paper events than online, but paper also tends to report fewer results per event. It's quite annoying, but paper events rarely report more than the Top 8, and far too often for my purposes, the Top 4. This makes the paper data far more variable than MTGO. December saw 594 decks, while January is up to 667. This seems like a big upswing, but is in fact well within the usual monthly variance for paper.
With significantly more decks recorded come more distinct decks. December had 84 but January is up to 101. Of those, 48 were singletons, which is why the data is so skewed. 19 decks made the tier list, which is low but understandable given all the singleton decks. The unadjusted average population was 6.62, so seven decks make Tier 3. The STDev was 12.07, so the increment is 12, on the higher end of what I'm used to. Remember, I always round down if the decimal is under .20. Therefore, Tier 3 runs from 7 to 19, Tier 2 is 20 to 32, and Tier 1 is 33 and over.
| Deck Name | Total # | Total % |
|---|---|---|
| Tier 1 | ||
| UR Murktide | 79 | 11.84 |
| Hammer Time | 50 | 7.50 |
| Rakdos Scam | 43 | 6.45 |
| 4-Color Creativity | 37 | 5.55 |
| Tier 2 | ||
| Amulet Titan | 30 | 4.50 |
| Merfolk | 27 | 4.05 |
| Burn | 27 | 4.05 |
| Counter Cat | 25 | 3.75 |
| Cascade Crashers | 24 | 3.60 |
| UW Control | 24 | 3.60 |
| 4-Color Rhinos | 20 | 3.00 |
| Tier 3 | ||
| Jeskai Value Breach | 19 | 2.85 |
| Mono-Green Tron | 19 | 2.85 |
| Living End | 18 | 2.70 |
| Yawgmoth | 18 | 2.70 |
| Jeskai Combo Breach | 17 | 2.55 |
| 4-Color Elementals | 12 | 1.80 |
| Izzet Prowess | 10 | 1.50 |
| 4-Color Blink | 9 | 1.35 |
| Grixis Shadow | 9 | 1.35 |
| Eldrazi Tron | 8 | 1.20 |

It's interesting how divided the Indomitable Creativity players are, not just between decks but across play type. Temur Creativity just piped 4-Color on MTGO and yet doesn't appear at all on the paper tier. No Creativity deck was Tier 1 on MTGO, while 4-Color is Tier 1 in paper. To me this suggests that the Creativity players are actively metagaming on MTGO and desperately seeking an edge where the paper players either can't or don't want to.
Worth noting that if all Creativity players were lumped together they'd be the third-place deck on MTGO. That's incorrect to do since they play differently, but it is something to contemplate.
December Power Metagame
Tracking the metagame in terms of population is standard practice. But how do results actually factor in? Better decks should also have better results. In an effort to measure this, I use a power ranking system in addition to the prevalence list. By doing so, I measure the relative strengths of each deck within the metagame.
The population method gives a deck that consistently just squeaks into the Top 32 the same weight as one that Top 8's. Using a power ranking rewards good results and moves the winningest decks to the top of the pile and better reflects their metagame potential.
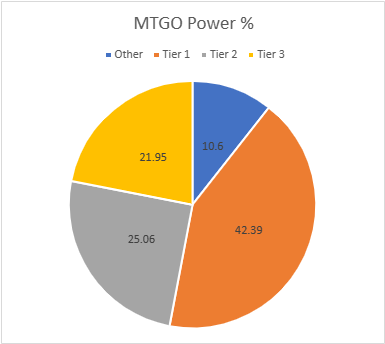
The MTGO Power Tiers
For the MTGO data, points are awarded based on the population of the event. Preliminaries award points based on record (1 for 3 wins, 2 for 4 wins, 3 for 5), and Challenges are scored 3 points for the Top 8, 2 for Top 16, and 1 for Top 32. If I can find them, non-Wizards events will be awarded points the same as Challenges or Preliminaries depending on what the event in question reports/behaves like. Super Qualifiers and similar higher-level events get an extra point and so do other events if they’re over 200 players, with a fifth point for going over 400 players. There were a few 4-point events and one 5-pointer that drastically increased the points for certain decks.
Total points rose just like the population, from 754 to 1321. The adjusted average points were 13.53, therefore 14 points made Tier 3. The STDev was 17.96, which is a little high. Thus add 18 to the starting point and Tier 3 runs to 32 points. Tier 2 starts with 33 points and runs to 51. Tier 1 requires at least 52 points.
All the decks from the population tier made the power tier. They're joined by Bring to Light, which doesn't put up many results but its very dedicated players do well in Challenges.
| Deck Name | Total Points | Total % |
|---|---|---|
| Tier 1 | ||
| UR Murtktide | 201 | 15.22 |
| Hammer Time | 146 | 11.05 |
| Rackdos Scam | 86 | 6.51 |
| UW Control | 66 | 5.00 |
| Yawgmoth | 61 | 4.62 |
| Tier 2 | ||
| Jeskai Value Breach | 51 | 3.86 |
| Cascade Crashers | 50 | 3.78 |
| Amulet Titan | 43 | 3.25 |
| Temur Creativity | 41 | 3.10 |
| Living End | 40 | 3.03 |
| 4-Color Creativity | 38 | 2.88 |
| Mono-Green Tron | 35 | 2.65 |
| Mono-Red Artifacts | 33 | 2.50 |
| Tier 3 | ||
| Burn | 29 | 2.19 |
| Jund Creativity | 26 | 1.97 |
| Jeskai Storm Breach | 26 | 1.97 |
| 4-Color Control | 24 | 1.82 |
| Grixis Shadow | 23 | 1.74 |
| Merfolk | 20 | 1.51 |
| 4-Color Rhinos | 18 | 1.36 |
| Mill | 18 | 1.36 |
| Bring to Light | 17 | 1.29 |
| Jeskai Combo Breach | 16 | 1.21 |
| Izzet Prowess | 15 | 1.14 |
| Counter Cat | 15 | 1.14 |
| Tribal Elementals | 15 | 1.14 |
| Dredge | 14 | 1.06 |
| Jund Saga | 14 | 1.06 |
That's a ridiculous number of points concentrated in the top decks. Also, I know that last week I said that the divide between Underworld Breach decks was small, but the data from that weekend completely blew that away. Value Breach pulled way ahead at the last minute. I suspect this has less to do with actual power so much as ease of play.
The Paper Power Tiers
Due to paper reporting being inconsistent compared to MTGO, I have to adapt how the points work. Applying the MTGO point system just doesn't work when I don't know how many points to award and there are data gaps. Thus, I award points based on the size of the tournament rather than placement. That way I'm being internally consistent with the paper results.
As I've mentioned previously, the points system for paper is changing starting this month. When I chose the original system last February, I was doing so completely arbitrarily because paper had just come back. A year on, and I have a better handle on what to expect, so here's the new system: For events with no reported starting population and those up to 32 players, one point is awarded. From 33 players up to 128 players gets two points. From 129 players up to 512 players gets three. Above 512 is four points and five points will be reserved for Modern Pro Tours if they ever happen. This lines up the point breakdowns with number of rounds rather than my prior arbitrary picks.
This system means that there were far more events awarding two and three points in January than ever before. I don't remember any event hitting the four-point threshold. December awarded 817 points while January rose to 1178. The average points were 11.68. This sets the cutoff at 12 decks. The STDev was 21.76, thus adding 22 to the starting point and Tier 3 runs to 34 points. Tier 2 starts with 35 points and runs to 57. Tier 1 requires at least 58 points. The total decks rose from 21 to 23. Bring to Light and Hardened Scales made it thanks to big events.
| Deck Name | Total Points | Total % |
|---|---|---|
| Tier 1 | ||
| UR Murktide | 133 | 11.29 |
| Hammer Time | 93 | 7.89 |
| Rakdos Scam | 79 | 6.71 |
| 4-Color Creativity | 77 | 6.54 |
| Tier 2 | ||
| Amulet Titan | 55 | 4.67 |
| Burn | 47 | 3.99 |
| Merfolk | 46 | 3.90 |
| UW Control | 44 | 3.73 |
| Jeskai Value Breach | 44 | 3.73 |
| Cascade Crashers | 43 | 3.65 |
| Counter Cat | 40 | 3.40 |
| 4-Color Rhinos | 37 | 3.14 |
| Tier 3 | ||
| Yawgmoth | 34 | 2.89 |
| Living End | 33 | 2.80 |
| Jeskai Combo Breach | 32 | 2.72 |
| Mono-Green Tron | 25 | 2.12 |
| 4-Color Blink | 19 | 1.61 |
| Grixis Shadow | 19 | 1.61 |
| 4-Color Elementals | 17 | 1.44 |
| Eldrazi Tron | 17 | 1.44 |
| Izzet Prowess | 16 | 1.36 |
| Bring to Light | 13 | 1.10 |
| Hardened Scales | 12 | 1.02 |
Interestingly, the Mono-Red Artifacts deck didn't do anything in paper. I only recorded two the whole month. It makes me wonder if the deck is actually good or just really well positioned for the MTGO meta. I suppose February will have the answer.
Average Power Rankings
Finally, we come to the average power rankings. These are found by taking the total points earned and dividing them by total decks, to measure points per deck. I use this to measure strength vs. popularity. Measuring deck strength is hard. There is no Wins-Above-Replacement metric for Magic, and I'm not certain that one could be credibly devised. The game is too complex, and even then, power is very contextual.
Using the power rankings certainly helps and serves to show how justified a deck’s popularity is. However, more popular decks will still necessarily earn a lot of points. Which tracks, but also means that the top tier doesn't move much between population and power, and obscures whether they really earned their position.
This is where the averaging comes in. Decks that earn a lot of points because they get a lot of results will do worse than decks that win more events, indicating which deck actually performs better. A higher average indicates lots of high finishes, whereas low averages result from mediocre performances and a high population. Lower-tier decks typically do very well here, likely due to their pilots being enthusiasts. Bear this in mind, and be careful about reading too much into these results. However, as a general rule, decks which place above the baseline average are overperforming and vice versa.
How far above or below that average determines how "justified" a deck's position is on the power tiers. Decks well above baseline are therefore undervalued while decks well below baseline are very popular but aren't necessarily good.
The Real Story
When considering the average points, the key is looking at how far-off a deck is from the Baseline stat (the overall average of points/population). The closer a deck’s performance to the Baseline, the more likely it is to be performing close to its “true” potential. A deck that is exactly average would therefore perform exactly as well as expected. The greater the deviation from the average, the more a deck under or over-performs. On the low end, a deck’s placing was mainly due to population rather than power, which suggests it’s overrated. A high-scoring deck is the opposite of this.
I'll begin with the averages for MTGO:
| Deck Name | Average Points | Power Tier |
|---|---|---|
| Bring to Light | 2.13 | 3 |
| Mill | 1.80 | 3 |
| UW Control | 1.78 | 1 |
| Rackdos Scam | 1.76 | 1 |
| Living End | 1.74 | 2 |
| 4-Color Creativity | 1.73 | 2 |
| Jeskai Storm Breach | 1.73 | 3 |
| Temur Creativity | 1.71 | 2 |
| UR Murtktide | 1.70 | 1 |
| Jeskai Value Breach | 1.70 | 2 |
| Merfolk | 1.67 | 3 |
| Yawgmoth | 1.65 | 1 |
| Mono-Red Artifacts | 1.65 | 2 |
| Cascade Crashers | 1.56 | 2 |
| Dredge | 1.56 | 3 |
| Jund Saga | 1.56 | 3 |
| Burn | 1.53 | 3 |
| Tier 1 | 1.50 | |
| 4-Color Control | 1.50 | 3 |
| 4-Color Rhinos | 1.50 | 3 |
| Tribal Elementals | 1.50 | 3 |
| Amulet Titan | 1.48 | 2 |
| Hammer Time | 1.45 | 1 |
| Mono-Green Tron | 1.40 | 2 |
| Grixis Shadow | 1.35 | 3 |
| Jund Creativity | 1.30 | 3 |
| Counter Cat | 1.25 | 3 |
| Jeskai Combo Breach | 1.23 | 3 |
| Izzet Prowess | 1.15 | 3 |
Well done, UW Control. As the top-placing Tier 1 deck, you're the Deck of the Month for MTGO. I'm as surprised as anyone.
Next up are the paper averages:
| Deck Name | Average Points | Power Tier |
|---|---|---|
| Hardened Scales | 3.00 | 3 |
| Bring to Light | 2.60 | 3 |
| Jeskai Value Breach | 2.31 | 2 |
| Eldrazi Tron | 2.13 | 3 |
| 4-Color Blink | 2.11 | 3 |
| Grixis Shadow | 2.11 | 3 |
| 4-Color Creativity | 2.08 | 1 |
| Yawgmoth | 1.89 | 3 |
| Jeskai Combo Breach | 1.88 | 3 |
| Hammer Time | 1.86 | 1 |
| 4-Color Rhinos | 1.85 | 2 |
| Rakdos Scam | 1.84 | 1 |
| Amulet Titan | 1.83 | 2 |
| UW Control | 1.83 | 2 |
| Living End | 1.83 | 3 |
| Cascade Crashers | 1.79 | 2 |
| Burn | 1.74 | 2 |
| Merfolk | 1.70 | 2 |
| UR Murktide | 1.68 | 1 |
| Baseline | 1.61 | |
| Counter Cat | 1.60 | 2 |
| Izzet Prowess | 1.60 | 3 |
| 4-Color Elementals | 1.42 | 3 |
| Mono-Green Tron | 1.31 | 3 |
4-Color Creativity, well done. You win for paper. I guess focusing in has its benefits, even if you are an aggregate of many different four-color decks. Congratulations on my refusal to split hairs.
Composite Metagame
That's a lot of data, but what does it all mean? When Modern Nexus first started, we had a statistical method to combine the MTGO and paper data, but the math of that system doesn't work without big paper events. I tried. Instead, I'm using an averaging system to combine the data. I take the MTGO results and average the tier, then separately average the paper results, then average the paper and MTGO results together for final tier placement.
This generates a lot of partial Tiers. That's not a bug, but a feature. The nuance separates the solidly Tiered decks from the more flexible ones and shows the true relative power differences between the decks. Every deck in the paper and MTGO results is on the table, and when they don't appear in a given category, they're marked N/A. This is treated as a 4 for averaging purposes.
| Deck Name | MTGO Pop. Tier | MTGO Power Tier | MTGO Average Tier | Paper Pop. Tier | Paper Power Tier | Paper Average Tier | Composite Tier |
|---|---|---|---|---|---|---|---|
| UR Murtktide | 1 | 1 | 1 | 1 | 1 | 1 | 1 |
| Hammer Time | 1 | 1 | 1 | 1 | 1 | 1 | 1 |
| Rackdos Scam | 1 | 1 | 1 | 1 | 1 | 1 | 1 |
| UW Control | 1 | 1 | 1 | 2 | 2 | 2 | 1.5 |
| 4-Color Creativity | 2 | 2 | 2 | 1 | 1 | 1 | 1.5 |
| Yawgmoth | 1 | 1 | 1 | 3 | 3 | 3 | 2 |
| Cascade Crashers | 2 | 2 | 2 | 2 | 2 | 2 | 2 |
| Amulet Titan | 2 | 2 | 2 | 2 | 2 | 2 | 2 |
| Jeskai Value Breach | 2 | 2 | 2 | 3 | 2 | 2.5 | 2.25 |
| Mono-Green Tron | 2 | 2 | 2 | 3 | 3 | 3 | 2.5 |
| Living End | 2 | 2 | 2 | 3 | 3 | 3 | 2.5 |
| Merfolk | 3 | 3 | 3 | 2 | 2 | 2 | 2.5 |
| 4-Color Rhinos | 3 | 3 | 3 | 2 | 2 | 2 | 2.5 |
| Counter Cat | 3 | 3 | 3 | 2 | 2 | 2 | 2.5 |
| Burn | 3 | 3 | 3 | 2 | 2 | 2 | 2.5 |
| Temur Creativity | 2 | 2 | 2 | N/A | N/A | N/A | 3 |
| Grixis Shadow | 3 | 3 | 3 | 3 | 3 | 3 | 3 |
| Jeskai Combo Breach | 3 | 3 | 3 | 3 | 3 | 3 | 3 |
| Izzet Prowess | 3 | 3 | 3 | 3 | 3 | 3 | 3 |
| Mono-Red Artifacts | 3 | 2 | 2.5 | N/A | N/A | N/A | 3.25 |
| Jund Creativity | 3 | 3 | 3 | N/A | N/A | N/A | 3.5 |
| 4-Color Control | 3 | 3 | 3 | N/A | N/A | N/A | 3.5 |
| Jeskai Storm Breach | 3 | 3 | 3 | N/A | N/A | N/A | 3.5 |
| Mill | 3 | 3 | 3 | N/A | N/A | N/A | 3.5 |
| Tribal Elementals | 3 | 3 | 3 | N/A | N/A | N/A | 3.5 |
| Dredge | 3 | 3 | 3 | N/A | N/A | N/A | 3.5 |
| Jund Saga | 3 | 3 | 3 | N/A | N/A | N/A | 3.5 |
| Bring to Light | N/A | 3 | 3.5 | N/A | 3 | 3.5 | 3.5 |
| 4-Color Elementals | N/A | N/A | N/A | 3 | 3 | 3 | 3.5 |
| 4-Color Blink | N/A | N/A | N/A | 3 | 3 | 3 | 3.5 |
| Eldrazi Tron | N/A | N/A | N/A | 3 | 3 | 3 | 3.5 |
| Hardened Scales | N/A | N/A | N/A | N/A | 3 | 3.5 | 3.75 |
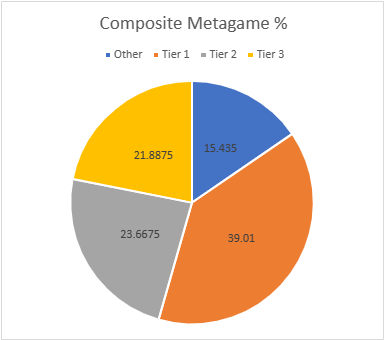
A reminder that the last column is the one that really matters. I normally bold that whole column but a recent update to TablePress made doing so prohibitively difficult. As usual, the decks at the top are exactly what an observant reader would expect.
That's the Way it Was
With this update, we must all bid farewell to that previous metagame and see what is now in store. One has a number of cards that promise to cause major changes in Modern. Whether those promises will be fulfilled or dashed has yet to be seen. I'll be discussing the implication in the Insiders article on Friday.
QS Insiders, join us Friday as I delve the deeper meanings of the January data, including the implications of early results with One. If you're not an Insider, consider subscribing today!
