Are you a Quiet Speculation member?
If not, now is a perfect time to join up! Our powerful tools, breaking-news analysis, and exclusive Discord channel will make sure you stay up to date and ahead of the curve.
Welcome to 2023! Hopefully, this year will be less 2020-esque than the previous... three. That's an unpleasant realization to have, right there... give me a minute. This new decade has sure been fun, hasn't it? At least things are looking up in general, so here's to hope.
On that high note, I must now transition into an ambiguous one: it's time for the Modern metagame update, whose data contains unpleasant news. Happy New Year? Today we'll review the data and methods, and on Friday, all these numbers will be analyzed for QS Insiders.
Outliers Remain the Norm
As has been the case for every month since March '22, there are outliers in the data. A lot of outliers, frankly. When the outlier was just UR Murktide it was anomalous and inconvenient, but ultimately explainable and ignorable. Players just like playing Izzet colors and velocity decks. However, such a persistent outlier signals a metagame warp. The fact that it's being joined again by Hammer Time and Rakdos Scam is a very strong confirmation of the warp's resilience.
Meanwhile, paper has unfortunately backslid. After two months without outliers, it now has two of them in Hammer Time and UR Murktide. I thought the warp was unraveling and would be limited to Magic Online (MTGO), but that is no longer the case. In turn, this raises the question of why the warp didn't manifest in October and November, with the likely answer being lack of data.
Also, there's an argument for excluding the third- and fourth-place decks as outliers. It's the kind of argument that my statistics professor would have required many pages of calculations to explain why I did or didn't exclude them. This isn't academia, so I included them, but know that I didn't have to. It will make sense when we get to the data.
As always, outliers are in their correct place on the metagame chart, but are excluded from the actual calculations, resulting in an adjusted average and standard deviation. Which means that more decks are on the tier list than would be otherwise.
December Population Metagame
To make the tier list, a given deck has to beat the overall average population for the month. The average is my estimate for how many results a given deck "should” produce in a given month. Being a tiered deck requires being better than “good enough.” Every deck that posts at least the average number of results is "good enough" and makes the tier list.
Then we go one standard deviation (STdev) above average to set the limit of Tier 3 and the cutoff for Tier 2. This mathematically defines Tier 3 as those decks clustered near the average. Tier 2 goes from the cutoff to the next standard deviation. These are decks that perform well above average. Tier 1 consists of those decks at least two standard deviations above the mean result, encompassing the truly exceptional performing decks.
The MTGO Population Data
In December the adjusted average population for MTGO was 5.52, setting the Tier 3 cutoff at six decks. This is a low average but up from the last two months even with three excluded outliers. Tier 3, therefore, begins with decks posting six results. The STdev was 6.49, which means that Tier 3 runs to 13 results. Again, it's the starting point to the cutoff, then the next whole number for the next Tier. Therefore Tier 2 starts with 14 results and runs to 21. Subsequently, to make Tier 1, 22 decks are required. As with the STdev, these numbers are slightly up from previous months.
As a final recap of 2022, January had 502 decks, February had 436 decks, March only hit 356, April was up to 437, May had 419, June had 481, July was 478, August was 507, September had 404, and October fell to 340 decks. November had the highest population in 2022 with 569 decks.
December has crashed to 460 decks, but that's not December's fault. The updater for the MTGO broke on December 20 and Daybreak didn't get it fixed before their holiday break, and so there's 11 days of MTGO results missing. I did get some events that non-Wizards sources put out, but this is a technical fault and shouldn't be read into. As of writing this sentence, the problem hasn't been fixed and I don't know when it will be, so I have to move ahead without that data. Deadlines and all that.
The number of individual decks fell back to 57 from November's 74. Given the actual spread in the data, I won't blame the technical fault for that. December was going to be less diverse than November even with the missing data. Of those 57 decks, 19 made the population tier. Which is relatively low, but had I left in the outliers only 13 would have made the list.
| Deck Name | Total # | Total % |
|---|---|---|
| Tier 1 | ||
| UR Murktide | 61 | 13.26 |
| Hammer Time | 54 | 11.74 |
| Rakdos Scam | 47 | 10.22 |
| Burn | 28 | 6.09 |
| Jeskai Breach | 26 | 5.65 |
| Tier 2 | ||
| Izzet Prowess | 20 | 4.35 |
| Amulet Titan | 20 | 4.35 |
| 4-Color Rhinos | 18 | 3.91 |
| Yawgmoth | 17 | 3.70 |
| Tier 3 | ||
| Jund Creativity | 12 | 2.61 |
| Counter Cat | 11 | 2.39 |
| Cascade Crashers | 10 | 2.17 |
| Living End | 9 | 1.96 |
| UW Control | 7 | 1.52 |
| Eldrazi Tron | 7 | 1.52 |
| Hardened Scales | 7 | 1.52 |
| Mono-Green Tron | 7 | 1.52 |
| Merfolk | 6 | 1.30 |
| Jund Saga | 6 | 1.30 |
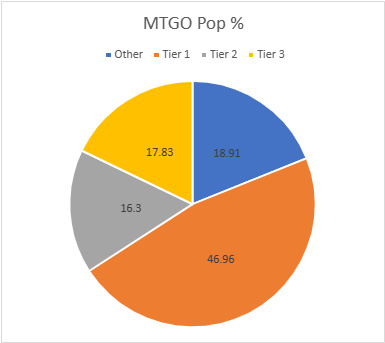
Again, the three outliers account for more than one-third of the total results. There have been warped months, but I haven't seen anything this persistent since the high of the companion era. Worth noting as a callback to last week's article: 60% of Tier 1 is Ragavan decks, accounting for ~29% of Modern. That doesn't feel healthy. The return of Izzet Prowess to the upper tiers is something to keep an eye on. White removal is being pushed out, and that's letting the old menace back in to the metagame.
The Paper Population Data
The paper tiers are calculated the same way as the MTGO tiers, just with different data. In most months there are far more reported paper events than online, but paper also tends to report fewer results per event. July had 783 decks, June had 640, and August recorded 594. September saw a surge up to 748 decks. The partial data for October had 467 decks, and November only saw 468. December saw an upswing to 594, which is impressive since events always petter out thanks to the holidays.
With significantly more decks recorded come more distinct decks. November had while December has 84. 22 of those decks made the tier list, just like November oddly enough. The adjusted average population was 5.58, so six decks make Tier 3. The STDev was 7.85, so the increment is eight, slightly down from November. Therefore, Tier 3 runs from 6 to 14, Tier 2 is 15 to 23, and Tier 1 is 24 and over.
| Deck Name | Total # | Total % |
|---|---|---|
| Tier 1 | ||
| UR Murktide | 84 | 14.14 |
| Hammer Time | 52 | 8.75 |
| Rakdos Scam | 40 | 6.73 |
| 4-Color Creativity | 36 | 6.06 |
| Merfolk | 27 | 4.54 |
| Tier 2 | ||
| Amulet Titan | 20 | 3.37 |
| Burn | 20 | 3.37 |
| Cascade Crashers | 20 | 3.37 |
| Izzet Prowess | 19 | 3.20 |
| Counter Cat | 18 | 3.03 |
| Mono-Green Tron | 18 | 3.03 |
| 4-Color Rhinos | 16 | 2.69 |
| Living End | 16 | 2.69 |
| Tier 3 | ||
| Affinity | 12 | 2.02 |
| Jeskai Breach Combo | 12 | 2.02 |
| Yawgmoth | 11 | 1.85 |
| Jund Saga | 10 | 1.68 |
| UW Control | 10 | 1.68 |
| Jund Creativity | 10 | 1.68 |
| 4-Color Control | 10 | 1.68 |
| Mill | 7 | 1.18 |
| Ponza | 6 | 1.01 |
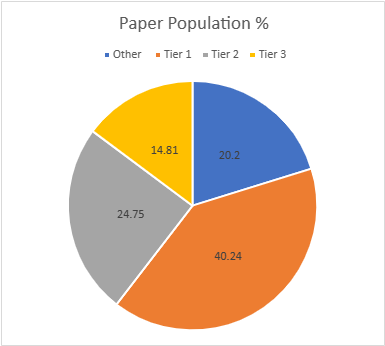
I don't know why, but Murktide has surged back to the top of Tier 1. I've never known why that deck is so popular other than Izzet colors are always popular, but here we are. It's a significant outlier over Hammer Time, which is in turn a comfortable outlier over Rakdos Scam. Scam and 4-Color Creativity aren't outliers thanks to Merfolk anchoring them, but it is very close, and the overall gap definitely makes a case for all Tier 1 being statistical outliers. That is concerning.
On an unrelated note, 4-Color Creativity was Tier 1 in paper while being untiered online. In fact, only one Creativity variant made the population list online. I don't know why the disparity exists, as the online lists don't look more prepared than paper lists. It could be the whims of MTGO again, or it could be the Creativity players can't agree on the optimal list and are spreading themselves too much. The paper 4-Color deck is an amalgamation of many different variants, so it could be that the online dissent is just more obvious.
December Power Metagame
Tracking the metagame in terms of population is standard practice. But how do results actually factor in? Better decks should also have better results. In an effort to measure this, I use a power ranking system in addition to the prevalence list. By doing so, I measure the relative strengths of each deck within the metagame. The population method gives a deck that consistently just squeaks into the Top 32 the same weight as one that Top 8's. Using a power ranking rewards good results and moves the winningest decks to the top of the pile and better reflects their metagame potential.
The MTGO Power Tiers
For the MTGO data, points are awarded based on the population of the event. Preliminaries award points based on record (1 for 3 wins, 2 for 4 wins, 3 for 5), and Challenges are scored 3 points for the Top 8, 2 for Top 16, and 1 for Top 32. If I can find them, non-Wizards events will be awarded points the same as Challenges or Preliminaries depending on what the event in question reports/behaves like. Super Qualifiers and similar higher-level events get an extra point and so do other events if they’re over 200 players, with a fifth point for going over 400 players. There were a few 4-point events and one 5 pointer that drastically increased the points for certain decks.
Total points fell just like the population, from 890 to 754. The adjusted average points were 9.11, therefore nine points made Tier 3. I round down for decimals under .20. The STDev was 10.52, which is average. Thus add 11 to the starting point and Tier 3 runs to 20 points. Tier 2 starts with 21 points and runs to 32. Tier 1 requires at least 33 points.
Total decks are the same in paper as on MTGO. However, Merfolk failed to make the power tier. Shed a tear. In its place Temur Saga, 4-Color Creativity, and true 5-Color Creativity made Tier 3. Creativity wins events, it just doesn't place in many, apparently.
| Deck Name | Total Points | Total % |
|---|---|---|
| Tier 1 | ||
| UR Murktide | 108 | 14.32 |
| Hammer Time | 81 | 10.74 |
| Rakdos Scam | 73 | 9.68 |
| Burn | 45 | 5.97 |
| Jeskai Breach | 37 | 4.91 |
| Yawgmoth | 34 | 4.51 |
| Amulet Titan | 33 | 4.38 |
| Tier 2 | ||
| Izzet Prowess | 31 | 4.11 |
| 4-Color Rhinos | 27 | 3.58 |
| Tier 3 | ||
| Jund Creativity | 20 | 2.65 |
| Counter Cat | 20 | 2.65 |
| Cascade Crashers | 20 | 2.65 |
| Living End | 19 | 2.52 |
| Jund Saga | 12 | 1.59 |
| UW Control | 11 | 1.46 |
| 5-Color Creativity | 11 | 1.46 |
| Mono-Green Tron | 10 | 1.33 |
| Eldrazi Tron | 9 | 1.19 |
| Hardened Scales | 9 | 1.19 |
| 4-Color Creativity | 9 | 1.19 |
| Temur Saga | 9 | 1.19 |
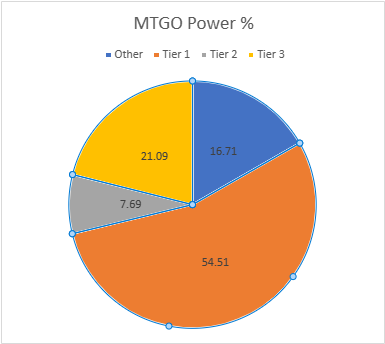
Tier 2 has almost disappeared as half the decks made Tier 1. As I said, the Super Qualifier had a huge effect. Tier 3 as massively shaken up as a result, but not enough to overcome the huge gap between it and Tier 2. This is a highly polarized metagame.
The Paper Power Tiers
Unlike with population, the paper power data works differently than the equivalent MTGO data. The data reported is usually limited to the Top 8 lists, even for big events. Not that I know how big most events are, as that number doesn't always get reported.
In other cases, decks are missing. Applying the MTGO point system just doesn't work when I don't know how many points to award and there are data gaps. Thus, I award points based on the size of the tournament rather than placement. That way I'm being internally consistent with the paper results.
The current system is that for events that don't report their starting populations or are under 50 players, I'm giving out 1 point. 51-300 players get 2 points. 301 and above get 3 points. I chose these levels based on the rarity of events over 300 compared to 100-200 and the fact that events under 300 tend to be local events in large cities. I will be changing how the points are allocated next year, starting with the January metagame update.
There were a huge number of events awarding 2 points in July and several 3-point events as well. Altogether December awarded 817 points, up from November's 660 points. The average points were 7.55. This sets the cutoff at eight decks. The STDev was 10.81, thus adding 11 to the starting point and Tier 3 runs to 19 points. Tier 2 starts with 20 points and runs to 31. Tier 1 requires at least 32 points. The total decks fell from 22 to 21. Ponza just didn't appear in larger events.
| Deck Name | Total Points | Total % |
|---|---|---|
| Tier 1 | ||
| UR Murktide | 119 | 14.56 |
| Hammer Time | 79 | 9.67 |
| Rakdos Scam | 53 | 6.49 |
| 4-Color Creativity | 49 | 6.00 |
| Merfolk | 37 | 4.53 |
| Tier 2 | ||
| Izzet Prowess | 29 | 3.55 |
| Counter Cat | 29 | 3.55 |
| Amulet Titan | 28 | 3.43 |
| Cascade Crashers | 28 | 3.43 |
| Mono-Green Tron | 25 | 3.06 |
| Burn | 24 | 2.94 |
| 4-Color Rhinos | 21 | 2.57 |
| Living End | 20 | 2.45 |
| Tier 3 | ||
| Jeskai Breach Combo | 18 | 2.20 |
| 4-Color Control | 17 | 2.08 |
| Yawgmoth | 15 | 1.84 |
| UW Control | 15 | 1.84 |
| Jund Creativity | 15 | 1.84 |
| Affinity | 13 | 1.59 |
| Jund Saga | 12 | 1.47 |
| Mill | 9 | 1.10 |

Now shout in triumph as Merfolk is solidly Tier 1 in paper Magic! This is most likely just a function of having a solid Murktide matchup and players metagaming, but I don't care. I've flown Merfolk's battered flag for a long time.
Average Power Rankings
Finally, we come to the average power rankings. These are found by taking the total points earned and dividing them by total decks, to measure points per deck. I use this to measure strength vs. popularity. Measuring deck strength is hard. There is no Wins-Above-Replacement metric for Magic, and I'm not certain that one could be credibly devised. The game is too complex, and even then, power is very contextual.
Using the power rankings certainly helps and serves to show how justified a deck’s popularity is. However, more popular decks will still necessarily earn a lot of points. Which tracks, but also means that the top tier doesn't move much between population and power, and obscures whether they really earned their position.
This is where the averaging comes in. Decks that earn a lot of points because they get a lot of results will do worse than decks that win more events, indicating which deck actually performs better. A higher average indicates lots of high finishes, whereas low averages result from mediocre performances and a high population. Lower-tier decks typically do very well here, likely due to their pilots being enthusiasts. Bear this in mind, and be careful about reading too much into these results. However, as a general rule, decks which place above the baseline average are overperforming and vice versa.
How far above or below that average determines how "justified" a deck's position is on the power tiers. Decks well above baseline are therefore undervalued while decks well below baseline are very popular but aren't necessarily good.
The Real Story
When considering the average points, the key is looking at how far-off a deck is from the Baseline stat (the overall average of points/population). The closer a deck’s performance to the Baseline, the more likely it is to be performing close to its “true” potential. A deck that is exactly average would therefore perform exactly as well as expected. The greater the deviation from the average, the more a deck under or over-performs. On the low end, a deck’s placing was mainly due to population rather than power, which suggests it’s overrated. A high-scoring deck is the opposite of this.
I'll begin with the averages for MTGO:
| Deck Name | Average Points | Power Tier |
|---|---|---|
| 5-Color Creativity | 2.75 | 3 |
| Temur Saga | 2.25 | 3 |
| Living End | 2.11 | 3 |
| Yawgmoth | 2.00 | 1 |
| Cascade Crashers | 2.00 | 3 |
| Jund Saga | 2.00 | 3 |
| Counter Cat | 1.82 | 3 |
| 4-Color Creativity | 1.80 | 3 |
| UR Murktide | 1.77 | 1 |
| 4-Color Rhinos | 1.72 | 2 |
| Baseline | 1.69 | |
| Jund Creativity | 1.67 | 3 |
| Amulet Titan | 1.65 | 1 |
| Burn | 1.61 | 1 |
| UW Control | 1.57 | 3 |
| Rakdos Scam | 1.55 | 1 |
| Hammer Time | 1.50 | 1 |
| Mono-Green Tron | 1.43 | 3 |
| Jeskai Breach Combo | 1.42 | 1 |
| Izzet Prowess | 1.35 | 2 |
| Eldrazi Tron | 1.28 | 3 |
| Hardened Scales | 1.28 | 3 |
Well done, Yawgmoth. You got enough points to be Tier 1 on power and that propelled you to Deck of the Month status. The great showing at the Super Qualifier really paid off.
Next up are the paper averages:
| Deck Name | Average Points | Power Tier |
|---|---|---|
| 4-Color Control | 1.70 | 3 |
| Counter Cat | 1.61 | 2 |
| Izzet Prowess | 1.53 | 2 |
| Hammer Time | 1.52 | 1 |
| Jeskai Breach Combo | 1.50 | 3 |
| UW Control | 1.50 | 3 |
| Jund Creativity | 1.50 | 3 |
| UR Murktide | 1.42 | 1 |
| Amulet Titan | 1.40 | 2 |
| Cascade Crashers | 1.40 | 2 |
| Mono-Green Tron | 1.39 | 2 |
| Merfolk | 1.37 | 1 |
| 4-Color Creativity | 1.36 | 1 |
| Yawgmoth | 1.36 | 3 |
| Rakdos Scam | 1.32 | 1 |
| Baseline | 1.31 | |
| 4-Color Rhinos | 1.31 | 2 |
| Mill | 1.29 | 3 |
| Living End | 1.25 | 2 |
| Burn | 1.20 | 2 |
| Jund Saga | 1.20 | 3 |
| Affinity | 1.08 | 3 |
Hammer Time is not only an outlier, but also the best averaging deck in paper. That's enough accolades, please leave some for other decks.
Composite Metagame
That's a lot of data, but what does it all mean? When Modern Nexus first started, we had a statistical method to combine the MTGO and paper data, but the math of that system doesn't work without big paper events. I tried. Instead, I'm using an averaging system to combine the data. I take the MTGO results and average the tier, then separately average the paper results, then average the paper and MTGO results together for final tier placement.
This generates a lot of partial Tiers. That's not a bug, but a feature. The nuance separates the solidly Tiered decks from the more flexible ones and shows the true relative power differences between the decks. Every deck in the paper and MTGO results is on the table, and when they don't appear in a given category, they're marked N/A. This is treated as a 4 for averaging purposes.
| Deck Name | MTGO Pop Tier | MTGO Power Tier | MTGO Average Tier | Paper Pop Tier | Paper Power Tier | Paper Average Tier | Composite Tier |
|---|---|---|---|---|---|---|---|
| Hammer Time | 1 | 1 | 1.00 | 1 | 1 | 1.00 | 1.00 |
| UR Murktide | 1 | 1 | 1.00 | 1 | 1 | 1.00 | 1.00 |
| Rakdos Scam | 1 | 1 | 1.00 | 1 | 1 | 1.00 | 1.00 |
| Burn | 1 | 1 | 1.00 | 2 | 2 | 2.00 | 1.50 |
| Amulet Titan | 2 | 1 | 1.50 | 2 | 2 | 2.00 | 1.75 |
| Jeskai Breach | 1 | 1 | 1.00 | 3 | 3 | 3.00 | 2.00 |
| Izzet Prowess | 2 | 2 | 2.00 | 2 | 2 | 2.00 | 2.00 |
| 4-Color Rhinos | 2 | 2 | 2.00 | 2 | 2 | 2.00 | 2.00 |
| Yawgmoth | 2 | 1 | 1.50 | 3 | 3 | 3,00 | 2.25 |
| Merfolk | 3 | N/A | 3.50 | 1 | 1 | 1.00 | 2.25 |
| 4-Color Creativity | N/A | 3 | 3.50 | 1 | 1 | 1.00 | 2.25 |
| Counter Cat | 3 | 3 | 3.00 | 2 | 2 | 2.00 | 2.50 |
| Cascade Crashers | 3 | 3 | 3.00 | 2 | 2 | 2.00 | 2.50 |
| Living End | 3 | 3 | 3.00 | 2 | 2 | 2.00 | 2.50 |
| Mono-Green Tron | 3 | 3 | 3.00 | 2 | 2 | 2.00 | 2.50 |
| Jund Creativity | 3 | 3 | 3.00 | 3 | 3 | 3.00 | 3.00 |
| UW Control | 3 | 3 | 3.00 | 3 | 3 | 3.00 | 3.00 |
| Jund Saga | 3 | 3 | 3.00 | 3 | 3 | 3.00 | 3.00 |
| Eldrazi Tron | 3 | 3 | 3.00 | N/A | N/A | N/A | 3.50 |
| Hardened Scales | 3 | 3 | 3.00 | N/A | N/A | N/A | 3.50 |
| Affinity | N/A | N/A | N/A | 3 | 3 | 3.00 | 3.50 |
| 4-Color Control | N/A | N/A | N/A | 3 | 3 | 3.00 | 3.50 |
| Mill | N/A | N/A | N/A | 3 | 3 | 3.00 | 3.50 |
| 5-Color Creativity | N/A | 3 | 3.50 | N/A | N/A | N/A | 3.75 |
| Temur Saga | N/A | 3 | 3.50 | N/A | N/A | N/A | 3.75 |
| Ponza | N/A | N/A | N/A | 3 | N/A | 3.50 | 3.75 |
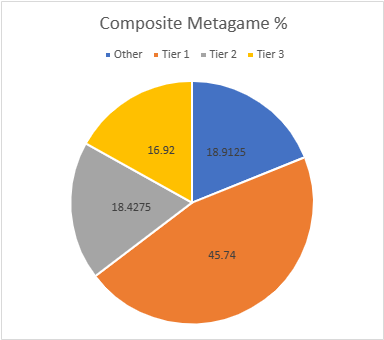
Tier 1 has increased its share of the overall metagame by 4.5% in December. That's not worrying at all. /s
To the New Year Anyway
And that concludes the metagame for 2022. I won't be doing a full retrospective on it because it's just been Murktide, Murktide, Hammer Time, and more Murktide all year. That said, I am changing how the points for paper work, and the January update will be the first time to showcase them. This time last year I had no idea what to expect from paper events, and just guessed at how to distribute points. Now that I have a clue, I'm adjusting accordingly.
Insiders, join us Friday as we parse the deeper meanings of the December data, including how a rising Tier deck excelled in paper but totally fell off online after some risky metagame calls.
