Are you a Quiet Speculation member?
If not, now is a perfect time to join up! Our powerful tools, breaking-news analysis, and exclusive Discord channel will make sure you stay up to date and ahead of the curve.
I haven't had to do that many metagame updates for February, it being the month where bans tend to happen. That wasn't the case this month, though I suspect that the data will add fuel to the banning call fires. I understand, but I'd caution everyone to consider the context before jumping to conclusions. February's data is defined by the Regional Championships and that created a localized warp.
The Lone Exception
Unfortunately I've gotten used to outliers in the Modern metagame data, especially Magic Online's data. It's what happens with an aggressively small playerbase (I've heard there are only 8000-9000 active accounts at a given time). I'd also thought I could tell when the data would produce an outlier. I was wrong, as despite my expectations, there are no outliers in the MTGO data and for the first time in a while it will be presented unadjusted. It was quite the surprise to me.
What absolutely wasn't surprising is that there is an outlier in the paper data. It was glaringly obvious, and you'll see why in roughly five paragraphs. Temur Rhinos is an outlier among outliers, but there is a reason beyond it being too good. As mentioned, there were several Regional Championships, and Rhinos showed up to them in huge numbers. This is common to large events, and since they were concentrated early in the month, there was nothing to balance against them. It's worth discussing, but don't read too much into this localized warp.
As always, statistical outliers are removed from the analysis but are reported on their correct position on the tier list, but there are weird stats behind these outliers.
February Population Metagame
To make the tier list, a given deck has to beat the overall average population for the month. The average is my estimate for how many results a given deck "should" produce in a given month. Being a tiered deck requires being better than "good enough". Every deck that posts at least the average number of results is "good enough" and makes the tier list.
Then we go one standard deviation (STdev) above average to set the limit of Tier 3 and the cutoff for Tier 2. This mathematically defines Tier 3 as those decks clustered near the average. Tier 2 goes from the cutoff to the next standard deviation. These are decks that perform well above average. Tier 1 consists of those decks at least two standard deviations above the mean result, encompassing the truly exceptional performing decks.
The MTGO data nearly exclusively comes from official Preliminary and Challenge results. Leagues are excluded, as they are curated lists and thus invalid. The paper data comes from any source I can find, with all reported events being counted.
While the MTGO events report predictable numbers, paper events can report anything from only the winner to all the results. In the latter case, if match results aren't included, I'll take as much of the Top 32 as possible. If match results are reported, I'll take winning record up to Top 32, and then any additional decks tied with 32nd place, as tiebreakers are a magic most foul and black.
A Note on the Data
Daybreak is now releasing the total results from every MTGO Preliminary and Challenge. After some experimentation, I'm sticking to just using the Challenge Top 32 results and 3-1 or better from the Preliminaries. The first reason is that, ultimately, nothing changed. The population metagame list didn't change between my normal method and the experimental versions. Various treatments for the power metagame did change the order of the tier list, but the composition varied only marginally.
The second reason was that dealing with all that data is significantly more work, even with automation. I'm not a great programmer but setting up and training the bots and then auditing the results took significantly longer than my current system, and I'd have to redo it monthly. Since it made little difference, I'm not going to make more work for myself. There are other sites that put together winrates with all the new data anyway, so I don't feel that anything's being lost. It also means that comparing the paper to MTGO results is easier.
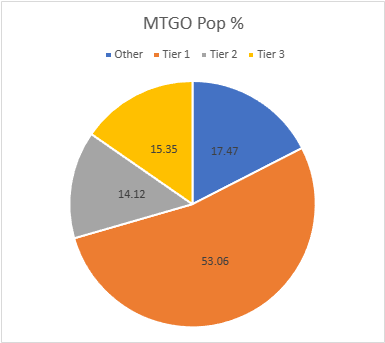
The MTGO Population Data
February's average population for MTGO was 13.92, setting the Tier 3 cutoff at 14 decks. I always round down if the decimal is less than .20. Tier 3, therefore, begins with decks posting 14 results. The STdev was 27.05, so add 27 and that means Tier 3 runs to 41 results. Again, it's the starting point to the cutoff, then the next whole number for the next Tier. Therefore Tier 2 starts with 42 results and runs to 69. Subsequently, to make Tier 1, 70 decks are required.
I thought that January's population would be hard to top and I was correct. However, it wasn't by much and February is a short month even with leap year. January had 1,400 decks, while February is just 1225. Turns out, if you schedule more events players will turn out. Take notes, Wizards Organized Play if you still exist.
Again, the high population came with didn't actually come with more true diversity. The total number of decks in my data set is down from 93 to 88. This improves the the ratio of unique decks to total sample actually fell .066 to .071, which is still low compared to 2023's average of .09. Fewer decks made the Tier List too, just 18 compared to January's 23.
| Deck Name | Total # | Total % |
|---|---|---|
| Tier 1 | ||
| Living End | 144 | 11.76 |
| Temur Rhinos | 102 | 8.33 |
| Yawgmoth | 99 | 8.08 |
| Rakdos Scam | 83 | 6.77 |
| 4-Color Rhinos | 77 | 6.29 |
| Amulet Titan | 73 | 5.96 |
| Izzet Murktide | 72 | 5.88 |
| Tier 2 | ||
| Counter Cat | 69 | 5.63 |
| Mono-Green Tron | 62 | 5.06 |
| UW Control | 42 | 3.43 |
| Tier 3 | ||
| 4-Color Creativity | 34 | 2.78 |
| Hardened Scales | 33 | 2.69 |
| Mill | 31 | 2.53 |
| Burn | 23 | 1.88 |
| 4-Color Control | 20 | 1.63 |
| Hammer Time | 18 | 1.47 |
| Goryo Blink | 15 | 1.22 |
| Merfolk | 14 | 1.14 |
I thought that Living End would qualify as an outlier due to the gap between it and Rhinos. However, the heavy skew in the data coupled with the STdev meant that it was just under the line as an outlier. If I were lazily grouping Temur and 4-Color Rhinos together, they would certainly have been an outlier, but I hold myself to higher standards.
On the subject of Leyline of the Guildpact, it has had an undeniable impact on MTGO's metagame, but I'm not convinced it will be sustained. New tech always gets eagerly adopted in huge numbers online but tapers off after about 2.5 weeks, and I am starting to see the fall-off. We've walked the path of 4-Color Rhinos before and it lost out to Temur before, I have little doubt it will do so again. Given that 4-Color was statistically tied in average points while Counter Cat's aren't spectacular, I expect both to fall off in March.
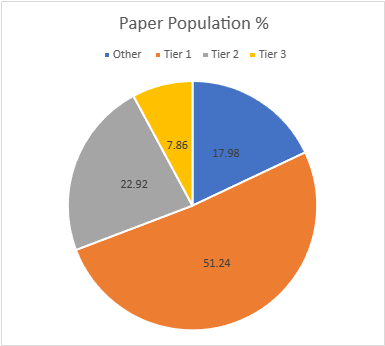
The Paper Population Data
February's paper data is higher than January's, though not by much. January reported 803 while February has 890. Given the number of events surrounding the RC's, even when taking into account the shorter month I expected the total population to be higher. I do know that a number of events that fired didn't report their results, as far as my Google-fu could find anyway.
That said, diversity hasn't changed. February has 102 unique decks and a ratio of .114, while January had 88 and a ratio of .110. It not falling is a good sign but only being higher without rounding isn't optimal. I can forgive it this time due to the RC warp, but I hope it's higher in March. Tiered decks stayed the same at 19. The adjusted average population was 7.61, so 8 results make the list. The adjusted STDev was 13.91, so the increment is 14. Therefore, Tier 3 runs from 8 to 22, Tier 2 is 23 to 37, and Tier 1 is 38 and over.
| Deck Name | Total # | Total % |
|---|---|---|
| Tier 1 | ||
| Temur Rhinos | 144 | 16.18 |
| Amulet Titan | 63 | 7.08 |
| Yawgmoth | 62 | 6.97 |
| Living End | 61 | 6.85 |
| Rakdos Scam | 49 | 5.51 |
| Izzet Murktide | 39 | 4.38 |
| Counter Cat | 38 | 4.27 |
| Tier 2 | ||
| Hammer Time | 36 | 4.04 |
| Burn | 32 | 3.60 |
| Hardened Scales | 29 | 3.26 |
| 4-Color Rhinos | 28 | 3.15 |
| Mono-Green Tron | 27 | 3.03 |
| 4-Color Control | 27 | 3.03 |
| UW Control | 25 | 2.81 |
| Tier 3 | ||
| 4-Color Creativity | 19 | 2.13 |
| Mill | 14 | 1.57 |
| Merfolk | 14 | 1.57 |
| Coffers | 14 | 1.57 |
| Temur Prowess | 9 | 1.01 |
As previously mentioned, Rhinos jumped out to a massive lead thanks to the RC's and associated events and just kept running away. I'm willing to write that off as a localized anomaly, but we really need to keep an eye on this with the March banning window approaching.
It's really unusual to see Tier 3 being so small. I'd not bat an eye if it was Tier 2, but February is an exception. Again, the RC's are to blame. If a deck showed up there, it showed up in multiple events and got carried for the rest of the month. Everything else fell behind.
February Power Metagame
Tracking the metagame in terms of population is standard practice. But how do results actually factor in? Better decks should also have better results. In an effort to measure this, I use a power ranking system in addition to the prevalence list. By doing so, I measure the relative strengths of each deck within the metagame so that a deck that just squeaks into Top 32 isn't valued the same as one that Top 8's. This better reflects metagame potential.
For the MTGO data, points are awarded based on the population of the event. Preliminaries award points based on record (1 for 3 wins, 2 for 4 wins, 3 for 5), and Challenges are scored 3 points for the Top 8, 2 for Top 16, and 1 for Top 32. If I can find them, non-Wizards events will be awarded points the same as Challenges or Preliminaries depending on what the event in question reports/behaves like. Super Qualifiers and similar higher-level events get an extra point and so do other events if they’re over 200 players, with a fifth point for going over 400 players.
Due to paper reporting being inconsistent and frequently full of data gaps compared to MTGO, its points work differently. I award points based on the size of the tournament rather than placement. For events with no reported starting population or up to 32 players, one point is awarded to every deck. Events with 33 players up to 128 players get two points. From 129 players up to 512 players get three. Above 512 is four points, and five points will be reserved for Modern Pro Tours.
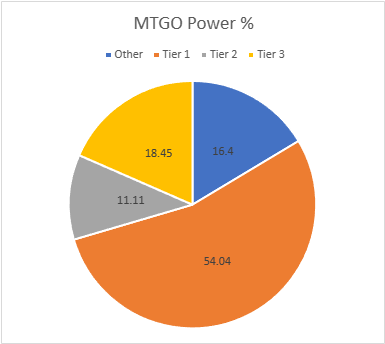
The MTGO Power Tiers
Unlike the population numbers, total points are slightly down, from 2051 in January to 1908. The disparity is due to there being only one 4-point event in February. The average points were 21.68, therefore 22 points made Tier 3. The STDev was 43.06, so add 43 to the starting point, and Tier 3 runs to 65 points. Tier 2 starts with 66 points and runs to 109. Tier 1 requires at least 110 points. The composition of the list has not changed, though there's been significant movement inside the tiers.
| Deck Name | Total Points | Total % |
|---|---|---|
| Tier 1 | ||
| Living End | 228 | 11.95 |
| Temur Rhinos | 163 | 8.54 |
| Yawgmoth | 161 | 8.44 |
| Rakdos Scam | 124 | 6.50 |
| 4-Color Rhinos | 124 | 6.50 |
| Izzet Murktide | 118 | 6.18 |
| Amulet Titan | 113 | 5.92 |
| Tier 2 | ||
| Mono-Green Tron | 107 | 5.61 |
| Counter Cat | 105 | 5.50 |
| Tier 3 | ||
| UW Control | 61 | 3.20 |
| Hardened Scales | 57 | 2.99 |
| 4-Color Creativity | 50 | 2.62 |
| Mill | 45 | 2.36 |
| Burn | 35 | 1.83 |
| 4-Color Control | 32 | 1.68 |
| Goryo Blink | 28 | 1,47 |
| Hammer Time | 22 | 1.15 |
| Merfolk | 22 | 1.15 |
I had some hope that the reemergence of Assault Loam and Kitchen last month would get some more brewing and innovation happening on MTGO, but alas, it seems they've already been discarded.
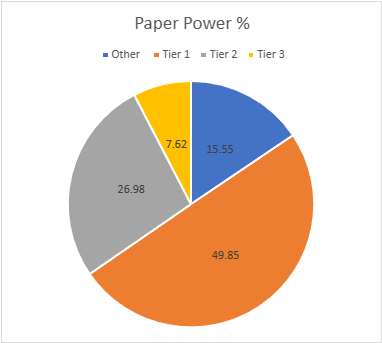
The Paper Power Tiers
Despite the RC's, February has fewer total points than January 1653 to 1709. There were fewer total events and they were concentrated in the first few weeks. The adjusted average points were 13.87, setting the cutoff at 14 points. The STDev was 26.98, thus add 27 to the starting point and Tier 3 runs to 41 points. Tier 2 starts with 42 points and runs to 69. Tier 1 requires at least 70 points. Again, the composition of the tiers hasn't changed despite movement inside them.
| Deck Name | Total Points | Total % |
|---|---|---|
| Tier 1 | ||
| Temur Rhinos | 290 | 17.54 |
| Amulet Titan | 131 | 7.92 |
| Living End | 123 | 7.44 |
| Yawgmoth | 114 | 6.70 |
| Rakdos Scam | 92 | 5.57 |
| Izzet Murktide | 74 | 4.48 |
| Tier 2 | ||
| Hammer Time | 65 | 3.93 |
| Counter Cat | 63 | 3.81 |
| Burn | 60 | 3.63 |
| 4-Color Rhinos | 60 | 3.63 |
| 4-Color Control | 59 | 3.57 |
| UW Control | 49 | 2.96 |
| Hardened Scales | 47 | 2.84 |
| Mono-Green Tron | 43 | 2.60 |
| Tier 3 | ||
| 4-Color Creativity | 40 | 2.42 |
| Merfolk | 26 | 1.57 |
| Mill | 23 | 1.39 |
| Coffers | 23 | 1.39 |
| Temur Prowess | 14 | 0.85 |
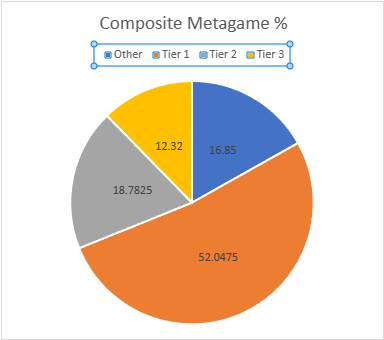
Composite Metagame
That's a lot of data, but what does it all mean? When Modern Nexus was first started, we had a statistical method to combine the MTGO and paper data, but the math of that system doesn't work without big paper events. I tried. Instead, I'm using an averaging system to combine the data. I take the MTGO results and average the tier, then separately average the paper results, then average the paper and MTGO results together for final tier placement.
This generates a lot of partial Tiers. That's not a bug, but a feature. The nuance separates the solidly Tiered decks from the more flexible ones and shows the true relative power differences between the decks. Every deck in the paper and MTGO results is on the table, and when they don't appear in a given category, they're marked N/A. This is treated as a 4 for averaging purposes.
| Deck Name | MTGO Pop Tier | MTGO Power Tier | MTGO Average Tier | Paper Pop Tier | Paper Power Tier | Paper Average Tier | Composite Tier |
|---|---|---|---|---|---|---|---|
| Living End | 1 | 1 | 1 | 1 | 1 | 1 | 1.00 |
| Temur Rhinos | 1 | 1 | 1 | 1 | 1 | 1 | 1.00 |
| Yawgmoth | 1 | 1 | 1 | 1 | 1 | 1 | 1.00 |
| Rakdos Scam | 1 | 1 | 1 | 1 | 1 | 1 | 1.00 |
| Amulet Titan | 1 | 1 | 1 | 1 | 1 | 1 | 1.00 |
| Izzet Murktide | 1 | 1 | 1 | 1 | 1 | 1 | 1.00 |
| 4-Color Rhinos | 1 | 1 | 1 | 2 | 2 | 2 | 1.50 |
| Counter Cat | 2 | 2 | 2 | 1 | 2 | 1.5 | 1.75 |
| Mono-Green Tron | 2 | 2 | 2 | 2 | 2 | 2 | 2.00 |
| UW Control | 2 | 3 | 2.5 | 2 | 2 | 2 | 2.25 |
| Hardened Scales | 3 | 3 | 3 | 2 | 2 | 2 | 2.50 |
| Burn | 3 | 3 | 3 | 2 | 2 | 2 | 2.50 |
| 4-Color Control | 3 | 3 | 3 | 2 | 2 | 2 | 2.50 |
| Hammer Time | 3 | 3 | 3 | 2 | 2 | 2 | 2.50 |
| 4-Color Creativity | 3 | 3 | 3 | 3 | 3 | 3 | 3.00 |
| Mill | 3 | 3 | 3 | 3 | 3 | 3 | 3.00 |
| Merfolk | 3 | 3 | 3 | 3 | 3 | 3 | 3.00 |
| Goryo Blink | 3 | 3 | 3 | N/A | N/A | N/A | 3.50 |
| Coffers | N/A | N/A | N/A | 3 | 3 | 3 | 3.50 |
| Temur Prowess | N/A | N/A | N/A | 3 | 3 | 3 | 3.50 |
Average Power Rankings
Finally, we come to the average power rankings. These are found by taking the total points earned and dividing them by total decks, to measure points per deck. I use this to measure strength vs. popularity. Measuring deck strength is hard. There is no Wins-Above-Replacement metric for Magic, and I'm not certain that one could be credibly devised. The game is too complex, and even then, power is very contextual.
Using the power rankings certainly helps and serves to show how justified a deck’s popularity is. However, more popular decks will still necessarily earn a lot of points. Therefore, the top tier doesn't move much between population and power and obscures whether its decks really earned their position.
This is where the averaging comes in. Decks that earn a lot of points because they get a lot of results will do worse than decks that win more events, indicating which deck actually performs better.
A higher average indicates lots of high finishes, whereas low averages result from mediocre performances and a high population. Lower-tier decks typically do very well here, likely due to their pilots being enthusiasts. Bear this in mind and be careful about reading too much into these results. However, as a general rule, decks that place above the baseline average are over-performing, and vice versa.
How far above or below that average a deck sits justifies its position on the power tiers. Decks well above baseline are undervalued, while decks well below baseline are very popular, but aren't necessarily good.
The Real Story
When considering the average points, the key is looking at how far off a deck is from the Baseline stat (the overall average of points/population). The closer a deck’s performance to the Baseline, the more likely it is to be performing close to its "true" potential.
A deck that is exactly average would therefore perform exactly as well as expected. The greater the deviation from the average, the more a deck under or over-performs. On the low end, a deck’s placing was mainly due to population rather than power, which suggests it’s overrated. A high-scoring deck is the opposite of this.
I'll begin with the averages for MTGO:
| Deck Name | Average Points | Power Tier |
|---|---|---|
| Goryo Blink | 1.87 | 3 |
| Mono-Green Tron | 1.73 | 2 |
| Hardened Scales | 1.72 | 3 |
| Izzet Murktide | 1.64 | 1 |
| Yawgmoth | 1.63 | 1 |
| 4-Color Rhinos | 1.61 | 1 |
| Temur Rhinos | 1.60 | 1 |
| 4-Color Control | 1.60 | 3 |
| Living End | 1.58 | 1 |
| Merfolk | 1.57 | 3 |
| Amulet Titan | 1.55 | 1 |
| Counter Cat | 1.52 | 2 |
| Burn | 1.52 | 3 |
| Rakdos Scam | 1.49 | 1 |
| 4-Color Creativity | 1.47 | 3 |
| UW Control | 1.45 | 3 |
| Mill | 1.45 | 3 |
| Baseline | 1.41 | |
| Hammer Time | 1.22 | 3 |
Well done Izzet Murktide, February's MTGO Deck of the Month. No longer king, but always a threat.
Now the paper averages:
| Deck Name | Average Points | Power Tier |
|---|---|---|
| 4-Color Control | 2.18 | 2 |
| 4-Color Rhinos | 2.14 | 2 |
| 4-Color Creativity | 2.10 | 3 |
| Amulet Titan | 2.08 | 1 |
| Living End | 2.02 | 1 |
| Temur Rhinos | 2.01 | 1 |
| UW Control | 1.96 | 2 |
| Izzet Murktide | 1.90 | 1 |
| Rakdos Scam | 1.88 | 1 |
| Burn | 1.88 | 2 |
| Merfolk | 1.86 | 3 |
| Yawgmoth | 1.84 | 1 |
| Hammer Time | 1.80 | 2 |
| Counter Cat | 1.66 | 2 |
| Mill | 1.64 | 3 |
| Baseline | 1.64 | |
| Coffers | 1.64 | 3 |
| Hardened Scales | 1.62 | 2 |
| Mono-Green Tron | 1.59 | 2 |
| Temur Prowess | 1.56 | 3 |
Amulet Titan is paper's Deck of the Month, not for the first time.
Analysis
The big story for February is the arrival of Murders at Markov Manor. While it came with a number of interesting role players, the unexpected headliner has been the new Leyline. There was a brief period where everyone was jamming it into every deck, but that has largely subsided. Instead, it has steady work in 4-Color Rhinos and Zoo deck, primarily Counter Cat variants, and has caused a stir in the metagame.
However, I haven't been too impressed. The driving force behind Leyline is actually Scion of Draco making itself into an unkillable and unraceable clock. It's quite good when it comes together, but we've been down this road before in multiple formats. It was called Soulflayer then, and much like Draco/Leyline, when Soulflayer comes together it's ridiculous but at all other times it's a bad joke. Given that the odds of the combo coming together on time are only about 20%, and Leyline is a very dead draw, I wouldn't hold out hope for the card.
Banning Risks
At time of writing, there's been no announcement concerning bannings in the March window. Wizards is still figuring out how this all works, so I can't predict if the lack of announcement means anything. However, given the observed data makes ban discussions reasonable, especially given how they talked about the goals of the last ban.
Specifically, banning Fury was supposed to open up the metagame and reduce the prevalence of Rakdos Scam. The latter goal was achieved; Scam is substantially down from its height. I know the deck gets a lot of hate, but it has unequivocally been successfully depowered. The former goal is far more ambiguous. The only previously top deck to have fallen off is 4-Color Control, but it was hit with two bans. Reducing Scam is correlated with Rhinos overtaking everything, and not many new decks have stuck.
I don't think that's enough for Wizards to justify intervening again. They Officially Hate banning cards and won't do so without a very strong reason. They can write off the lack of diversification as players being stubborn or that it will change naturally with Modern Horizons 3 coming this summer. Thus, the only way I see a ban coming to Modern is if the cascade decks have too-high win rates, which I didn't gather the data to evaluate.
Financial Implications
I believe that whatever opportunities arose in the wake of Leyline of the Guildpact have run their course. Whatever large-scale adoption that was going to happen has, and any further converts will be a relative trickle. If you've invested into those decks with the intention to flip the cards, I'd watch the price trends very carefully and be ready to bail. If the combo with Scion isn't good enough, then the only non-Valakut, the Molten Pinnacle reason to run Leyline is painless mana fixing, and that's not really good enough in Modern. Again, just like what happened with 4-Color Rhinos last year.
As for a potential banning, the only card that makes sense to ban from the cascade decks is one of the cascaders, not a namesake card. Wizards doesn't like to outright kill decks. If Wizards wants to disrupt the decks without really nerfing them, they'd hit Shardless Agent, but that doesn't make sense. They'd just go for more colors and be about the same power-wise. Thus, I'd be watching for Violent Outburst to get banned instead.
