
Are you a Quiet Speculation member?
If not, now is a perfect time to join up! Our powerful tools, breaking-news analysis, and exclusive Discord channel will make sure you stay up to date and ahead of the curve.
It's the first metagame update of the new year! It's not an entirely new metagame, but it is at least notably different from the last one. The forces within Modern that create the metagame don't just subside when the calendar changes, after all. That said, there's innovation present and a changeover at the top of the metagame showing that the effects of the last ban are still working themselves out.
An Odd Occurrence
As has been the standard for two years now, there are outliers in the data, and in both play mediums. In defiance of December's decline, Modern is back to having multiple statistical outliers in both paper and Magic Online (MTGO). However, there's some oddness to the result this time.
MTGO has four outliers: Rakdos Scam, Yawgmoth, Temur Rhinos, and Izzet Murktide. Paper has two, Rhinos and Scam. As always, statistical outliers are removed from the analysis but are reported on their correct position on the tier list, but there are weird stats behind these outliers.
How to find outliers and when to remove them from a data set is something that statisticians argue about relentlessly. Everyone agrees that true outliers must be removed, but what constitutes a true outlier has no clear answer. Rather than get lost in the weeds, I do four different outlier tests and I always remove the decks that are consistently shown to be outliers. I want to include the maximum number of decks on the Tier List.
Normally there's broad agreement between the tests on which decks are outliers with only the borderline ones being disputed. This month was weird as the three tests which use variants on the Interquartile Range all returned the aforementioned outliers, but the z-test one didn't return any outliers. That's never happened before. I'm not a good enough statistical theorist to know what that means, if there's one out there who does know, please explain.
January Population Metagame
To make the tier list, a given deck has to beat the overall average population for the month. The average is my estimate for how many results a given deck "should" produce in a given month. Being a tiered deck requires being better than "good enough". Every deck that posts at least the average number of results is "good enough" and makes the tier list.
Then we go one standard deviation (STdev) above average to set the limit of Tier 3 and the cutoff for Tier 2. This mathematically defines Tier 3 as those decks clustered near the average. Tier 2 goes from the cutoff to the next standard deviation. These are decks that perform well above average. Tier 1 consists of those decks at least two standard deviations above the mean result, encompassing the truly exceptional performing decks.
The MTGO data nearly exclusively comes from official Preliminary and Challenge results. Leagues are excluded, as they are curated lists and thus invalid. The paper data comes from any source I can find, with all reported events being counted.
While the MTGO events report predictable numbers, paper events can report anything from only the winner to all the results. In the latter case, if match results aren't included, I'll take as much of the Top 32 as possible. If match results are reported, I'll take winning record up to Top 32, and then any additional decks tied with 32nd place, as tiebreakers are a magic most foul and black.
A Note on the Data
Daybreak is now releasing the total results from every MTGO Preliminary and Challenge. After some experimentation, I'm sticking to just using the Challenge Top 32 results and 3-1 or better from the Preliminaries. The first reason is that, ultimately, nothing changed. The population metagame list didn't change between my normal method and the experimental versions. Various treatments for the power metagame did change the order of the tier list, but the composition varied only marginally.
The second reason was that dealing with all that data is significantly more work, even with automation. I'm not a great programmer but setting up and training the bots and then auditing the results took significantly longer than my current system, and I'd have to redo it monthly. Since it made little difference, I'm not going to make more work for myself. There are other sites that put together winrates with all the new data anyway, so I don't feel that anything's being lost. It also means that comparing the paper to MTGO results is easier.
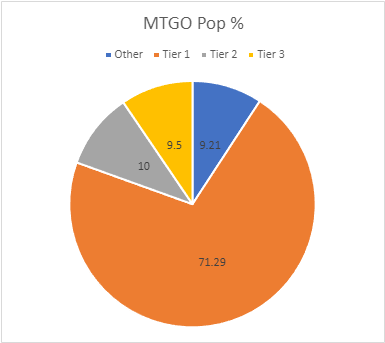
The MTGO Population Data
January's adjusted average population for MTGO was 6.80, setting the Tier 3 cutoff at 7 decks. I always round down if the decimal is less than .20. Tier 3, therefore, begins with decks posting 7 results. The adjusted STdev was 13.80, so add 14 and that means Tier 3 runs to 21 results. Again, it's the starting point to the cutoff, then the next whole number for the next Tier. Therefore Tier 2 starts with 22 results and runs to 36. Subsequently, to make Tier 1, 37 decks are required.
Even though I'm not using all the new data, January 2024's population still blows every other month out of the water. The highest population from 2023 was 1,003, while January has 1,400 decks, 500 more than December. I can't say if this is just the result of more events or if Modern's gained popularity recently, but it is definitely the largest sample since 2021.
However, the high population came with didn't actually come with more true diversity. The total number of decks in my data set is up from 69 to 93. However, given the total population, the ratio of unique decks to total sample actually fell from .072 to .066. 2023's average was .09, so 2024 is not starting out well. 23 decks made the Tier List.
| Deck Name | Total # | Total % |
|---|---|---|
| Tier 1 | ||
| Rakdos Scam | 248 | 17.71 |
| Yawgmoth | 198 | 14.14 |
| Temur Rhinos | 192 | 13.71 |
| UR Murktide | 157 | 11.21 |
| Amulet Titan | 88 | 6.29 |
| Living End | 71 | 5.07 |
| Hardened Scales | 44 | 3.14 |
| Tier 2 | ||
| 4-Color Control | 35 | 2.50 |
| UW Control | 31 | 2.21 |
| 4-Color Creativity | 25 | 1.79 |
| Burn | 25 | 1.79 |
| Coffers | 24 | 1.71 |
| Tier 3 | ||
| Counter Cat | 19 | 1.36 |
| Mono-Green Tron | 17 | 1.21 |
| Hammer Time | 17 | 1.21 |
| Merfolk | 15 | 1.07 |
| Rakdos Kitchen | 12 | 0.86 |
| Jund Saga | 10 | 0.71 |
| Mill | 10 | 0.71 |
| Assault Loam | 10 | 0.71 |
| Wrenn White and Blue | 9 | 0.64 |
| Temur Prowess | 7 | 0.50 |
| Twiddle Breach | 7 | 0.50 |
There's a clear reason for the four outliers I previously mentioned. The top decks hold an absurd metagame share. The comfort is that this isn't like pre-December Modern where Scam was crushing everything else, but it still isn't optimal or desirable. However, I offer this crumb of comfort: the paper results tell a very different story. I believe that this massive warp in the MTGO results is the result of players chasing their tails more than a fully unhealthy metagame.
The Paper Population Data
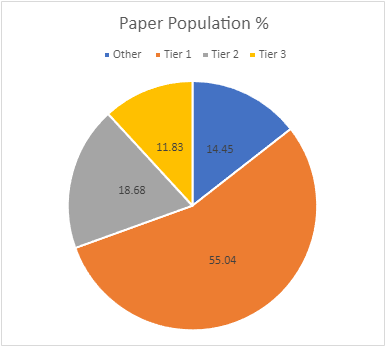
January's paper data also saw a huge increase, though that's not unusual. December only managed 429 decks because events always taper off for the holidays. January always brings a large resurgence and 2024 was no different, as 803 decks were recorded, well above the norm for 2023. Good sign.
Diversity increased absolute terms but not relative ones. December had 67 unique decks and a ratio of .16, while January has 88 and a ratio of .11, which was incidentally 2023's average. Not as good as it was, but much better than MTGO. Tiered decks rose from 17 to 19. The adjusted average population was 6.96, so 7 results make the list. The adjusted STDev was 14.10, so the increment is 14. Therefore, Tier 3 runs from 7 to 21, Tier 2 is 22 to 36, and Tier 1 is 37 and over, just like MTGO which is unusual.
| Deck Name | Total Points | Total % |
|---|---|---|
| Tier 1 | ||
| Temur Rhinos | 110 | 13.70 |
| Rakdos Scam | 94 | 11.71 |
| Yawgmoth | 75 | 9.34 |
| Amulet Titan | 64 | 7.97 |
| UR Murktide | 61 | 7.60 |
| Mono-Green Tron | 38 | 4.73 |
| Tier 2 | ||
| Hammer Time | 35 | 4.36 |
| Living End | 33 | 4.11 |
| Hardened Scales | 33 | 4.11 |
| Burn | 27 | 3.36 |
| 4-Color Control | 22 | 2.74 |
| Tier 3 | ||
| Merfolk | 18 | 2.24 |
| Counter Cat | 18 | 2.24 |
| UW Control | 14 | 1.74 |
| Coffers | 13 | 1.62 |
| Izzet Wizards | 10 | 1.24 |
| 4-Color Creativity | 8 | 1.00 |
| Jund Saga | 7 | 0.87 |
| Mill | 7 | 0.87 |
Paper's concentration is back in line with the norm from 2023. That's not a great place to be, but it is better than what's happening on MTGO. Interestingly, up until the European Championship in Ghent at the end of the month, the top five decks weren't ahead of the rest of the pack by much. It was that event and associated side events that made paper's top look closer to MTGO's and created the outliers.
October Power Metagame
Tracking the metagame in terms of population is standard practice. But how do results actually factor in? Better decks should also have better results. In an effort to measure this, I use a power ranking system in addition to the prevalence list. By doing so, I measure the relative strengths of each deck within the metagame so that a deck that just squeaks into Top 32 isn't valued the same as one that Top 8's. This better reflects metagame potential.
For the MTGO data, points are awarded based on the population of the event. Preliminaries award points based on record (1 for 3 wins, 2 for 4 wins, 3 for 5), and Challenges are scored 3 points for the Top 8, 2 for Top 16, and 1 for Top 32. If I can find them, non-Wizards events will be awarded points the same as Challenges or Preliminaries depending on what the event in question reports/behaves like. Super Qualifiers and similar higher-level events get an extra point and so do other events if they’re over 200 players, with a fifth point for going over 400 players.
Due to paper reporting being inconsistent and frequently full of data gaps compared to MTGO, its points work differently. I award points based on the size of the tournament rather than placement. For events with no reported starting population or up to 32 players, one point is awarded to every deck. Events with 33 players up to 128 players get two points. From 129 players up to 512 players get three. Above 512 is four points, and five points will be reserved for Modern Pro Tours.
The MTGO Power Tiers
As with population, total points are significantly up, from 1528 in December to 2051. Multiple 4-point events will do that. The adjusted average points were 9.68, therefore 10 points made Tier 3. The adjusted STDev was 19.81, so add 20 to the starting point, and Tier 3 runs to 30 points. Tier 2 starts with 31 points and runs to 51. Tier 1 requires at least 52 points. Temur Prowess fell off and was replaced by Dimir Shadow.
| Deck Name | Total Points | Total % |
|---|---|---|
| Tier 1 | ||
| Rakdos Scam | 366 | 17.84 |
| Temur Rhinos | 304 | 14.82 |
| Yawgmoth | 292 | 14.24 |
| UR Murktide | 229 | 11.17 |
| Amulet Titan | 125 | 6.09 |
| Living End | 98 | 4.78 |
| Hardened Scales | 64 | 3.12 |
| 4-Color Control | 59 | 2.88 |
| Tier 2 | ||
| UW Control | 40 | 1.95 |
| 4-Color Creativity | 38 | 1.85 |
| Burn | 38 | 1.85 |
| Coffers | 36 | 1.76 |
| Tier 3 | ||
| Counter Cat | 29 | 1.41 |
| Hammer Time | 24 | 1.17 |
| Merfolk | 23 | 1.12 |
| Mono-Green Tron | 21 | 1.02 |
| Assault Loam | 17 | 0.83 |
| Rakdos Kitchen | 15 | 0.73 |
| Wrenn White and Blue | 14 | 0.68 |
| Mill | 13 | 0.63 |
| Jund Saga | 11 | 0.54 |
| Twiddle Breach | 11 | 0.54 |
| Dimir Shadow | 10 | 0.49 |
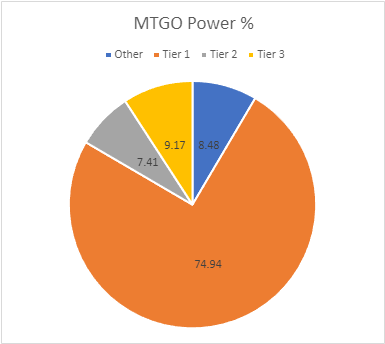
As with the population, the population totals are wildly unbalanced, but that's what happens when the small MTGO player base has groupthought that Modern is solved. The evidence of the reemergence of Assault Loam and Kitchen decks apparently doing little to change their minds.
The Paper Power Tiers
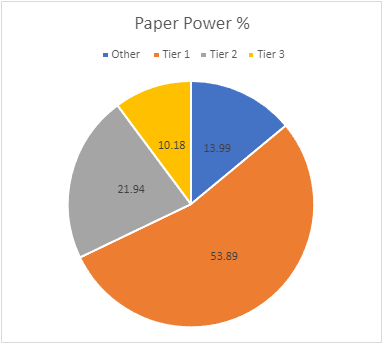
Thanks to the return of large events, January's point total is quite high. December only hit 758 but January has 1709. The adjusted average points were 14.27, setting the cutoff at 15 points. The STDev was 30.42, thus add 31 to the starting point and Tier 3 runs to 46 points. Tier 2 starts with 47 points and runs to 78. Tier 1 requires at least 79 points. Both Jund Saga and Mill fell off the list and weren't replaced.
| Deck Name | Total Points | Total % |
|---|---|---|
| Tier 1 | ||
| Temur Rhinos | 270 | 15.80 |
| Rakdos Scam | 212 | 12.40 |
| Yawgmoth | 174 | 10.18 |
| Amulet Titan | 133 | 7.78 |
| UR Murktide | 132 | 7.72 |
| Tier 2 | ||
| Hammer Time | 75 | 4.39 |
| Hardened Scales | 68 | 3.98 |
| Living End | 64 | 3.74 |
| Mono-Green Tron | 63 | 3.69 |
| Burn | 53 | 3.10 |
| 4-Color Control | 52 | 3.04 |
| Tier 3 | ||
| Counter Cat | 45 | 2.63 |
| Merfolk | 34 | 1.99 |
| Coffers | 32 | 1.87 |
| UW Control | 28 | 1.64 |
| Izzet Wizards | 19 | 1.11 |
| 4-Color Creativity | 16 | 0.94 |
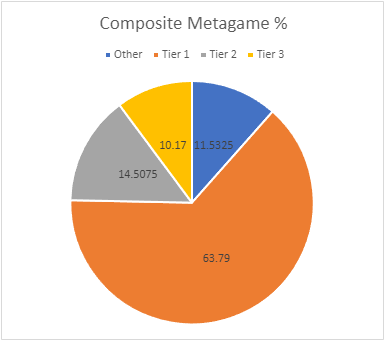
Composite Metagame
That's a lot of data, but what does it all mean? When Modern Nexus was first started, we had a statistical method to combine the MTGO and paper data, but the math of that system doesn't work without big paper events. I tried. Instead, I'm using an averaging system to combine the data. I take the MTGO results and average the tier, then separately average the paper results, then average the paper and MTGO results together for final tier placement.
This generates a lot of partial Tiers. That's not a bug, but a feature. The nuance separates the solidly Tiered decks from the more flexible ones and shows the true relative power differences between the decks. Every deck in the paper and MTGO results is on the table, and when they don't appear in a given category, they're marked N/A. This is treated as a 4 for averaging purposes.
| Deck Name | MTGO Pop Tier | MTGO Power Tier | MTGO Average Tier | Paper Pop Tier | Paper Power Tier | Paper Average Tier | Composite Tier |
|---|---|---|---|---|---|---|---|
| Rakdos Scam | 1 | 1 | 1 | 1 | 1 | 1 | 1.00 |
| Yawgmoth | 1 | 1 | 1 | 1 | 1 | 1 | 1.00 |
| Temur Rhinos | 1 | 1 | 1 | 1 | 1 | 1 | 1.00 |
| UR Murktide | 1 | 1 | 1 | 1 | 1 | 1 | 1.00 |
| Amulet Titan | 1 | 1 | 1 | 1 | 1 | 1 | 1.00 |
| Living End | 1 | 1 | 1 | 2 | 2 | 2 | 1.50 |
| Hardened Scales | 1 | 1 | 1 | 2 | 2 | 2 | 1.50 |
| 4-Color Control | 2 | 1 | 1.5 | 2 | 2 | 2 | 1.75 |
| Burn | 2 | 2 | 2 | 2 | 2 | 2 | 2.00 |
| Mono-Green Tron | 3 | 3 | 3 | 1 | 2 | 1.5 | 2.25 |
| UW Control | 2 | 2 | 2 | 3 | 3 | 3 | 2.50 |
| 4-Color Creativity | 2 | 2 | 2 | 3 | 3 | 3 | 2.50 |
| Coffers | 2 | 2 | 2 | 3 | 3 | 3 | 2.50 |
| Hammer Time | 3 | 3 | 3 | 2 | 2 | 2 | 2.50 |
| Counter Cat | 3 | 3 | 3 | 3 | 3 | 3 | 3.00 |
| Merfolk | 3 | 3 | 3 | 3 | 3 | 3 | 3.00 |
| Jund Saga | 3 | 3 | 3 | 3 | N/A | 3.5 | 3.25 |
| Mill | 3 | 3 | 3 | 3 | N/A | 3.5 | 3.25 |
| Rakdos Kitchen | 3 | 3 | 3 | N/A | N/A | N/A | 3.50 |
| Assault Loam | 3 | 3 | 3 | N/A | N/A | N/A | 3.50 |
| Wrenn White and Blue | 3 | 3 | 3 | N/A | N/A | N/A | 3.50 |
| Twiddle Breach | 3 | 3 | 3 | N/A | N/A | N/A | 3.50 |
| Izzet Wizards | N/A | N/A | N/A | 3 | 3 | 3 | 3.50 |
| Temur Prowess | 3 | N/A | 3.5 | N/A | N/A | N/A | 3.75 |
Average Power Rankings
Finally, we come to the average power rankings. These are found by taking the total points earned and dividing them by total decks, to measure points per deck. I use this to measure strength vs. popularity. Measuring deck strength is hard. There is no Wins-Above-Replacement metric for Magic, and I'm not certain that one could be credibly devised. The game is too complex, and even then, power is very contextual.
Using the power rankings certainly helps and serves to show how justified a deck’s popularity is. However, more popular decks will still necessarily earn a lot of points. Therefore, the top tier doesn't move much between population and power and obscures whether its decks really earned their position.
This is where the averaging comes in. Decks that earn a lot of points because they get a lot of results will do worse than decks that win more events, indicating which deck actually performs better.
A higher average indicates lots of high finishes, whereas low averages result from mediocre performances and a high population. Lower-tier decks typically do very well here, likely due to their pilots being enthusiasts. Bear this in mind and be careful about reading too much into these results. However, as a general rule, decks that place above the baseline average are over-performing, and vice versa.
How far above or below that average a deck sits justifies its position on the power tiers. Decks well above baseline are undervalued, while decks well below baseline are very popular, but aren't necessarily good.
The Real Story
When considering the average points, the key is looking at how far off a deck is from the Baseline stat (the overall average of points/population). The closer a deck’s performance to the Baseline, the more likely it is to be performing close to its "true" potential.
A deck that is exactly average would therefore perform exactly as well as expected. The greater the deviation from the average, the more a deck under or over-performs. On the low end, a deck’s placing was mainly due to population rather than power, which suggests it’s overrated. A high-scoring deck is the opposite of this.
I'll begin with the averages for MTGO:
| Deck Name | Average Points | Power Tier |
|---|---|---|
| Dimir Shadow | 2.00 | 3 |
| Assault Loam | 1.70 | 3 |
| 4-Color Control | 1.69 | 1 |
| Temur Rhinos | 1.58 | 1 |
| Twiddle Breach | 1.57 | 3 |
| Wrenn White and Blue | 1.56 | 3 |
| Counter Cat | 1.53 | 3 |
| Merfolk | 1.53 | 3 |
| 4-Color Creativity | 1.52 | 2 |
| Burn | 1.52 | 2 |
| Coffers | 1.50 | 2 |
| Rakdos Scam | 1.48 | 1 |
| Yawgmoth | 1.47 | 1 |
| UR Murktide | 1.46 | 1 |
| Hardened Scales | 1.45 | 1 |
| Amulet Titan | 1.42 | 1 |
| Hammer Time | 1.41 | 3 |
| Baseline | 1.40 | |
| Living End | 1.38 | 1 |
| Mill | 1.30 | 3 |
| UW Control | 1.29 | 2 |
| Rakdos Kitchen | 1.25 | 3 |
| Mono-Green Tron | 1.24 | 3 |
| Jund Saga | 1.10 | 3 |
Despite all the chatter about its death, 4-Color Control managed to take January's MTGO Deck of the Month. Impressive work.
Now the paper averages:
| Deck Name | Average points | Power Tier |
|---|---|---|
| Rakdos Scam | 2.55 | 1 |
| Counter Cat | 2.50 | 3 |
| Coffers | 2.46 | 3 |
| Temur Rhinos | 2.45 | 1 |
| 4-Color Control | 2.36 | 2 |
| Yawgmoth | 2.32 | 1 |
| UR Murktide | 2.16 | 1 |
| Hammer Time | 2.14 | 2 |
| Amulet Titan | 2.08 | 1 |
| Hardened Scales | 2.06 | 2 |
| UW Control | 2.00 | 3 |
| 4-Color Creativity | 2.00 | 3 |
| Burn | 1.96 | 2 |
| Living End | 1.94 | 2 |
| Izzet Wizards | 1.90 | 3 |
| Baseline | 1.90 | |
| Merfolk | 1.89 | 3 |
| Mono-Green Tron | 1.66 | 2 |
Annoyingly, Rakdos Scam takes home paper's Deck of the Month. Well, it just gives the haters more ammunition, I guess.
Analysis
January's headline is the huge warp in MTGO's data and how the same warp isn't really reflected in paper. While there's a clear sign that the top five decks are the top decks in Modern, there's a big asterisk. I've repeatedly mentioned the problem of MTGO's data being driven by a small group, but it goes further when Ghent is considered. The gap between Tier 2 and Tier 1 didn't emerge until that event, which strongly suggests that a self-fulfilling prophecy is in effect.
Every competitive player wants to win the whole event. Therefore, they want to play the strongest deck to maximize their chances. There are many ways that can go and in a healthy metagame there's no clear answer and players are incentivized to play a variety of decks with many strengths and weaknesses. However, if players become convinced that there are only a small number of viable decks, they'll only play them ensuring that only a small number seem viable and the prophecy is fulfilled, regardless of it being true.
It is far easier for this to happen online than in reality. However, really big events will bring out the Spikiest of Spikes, many of whom will test online and thus be susceptible to the groupthink. Thus, I saw the paper data suddenly turn towards looking like the online data thanks to one event where it hadn't previously. This is likely to be true for February too thanks to the Regional Championships (RCs).
Financial Implications
Magic card prices have been on a general downward trend thanks to wallet burnout and player fatigue. Modern prices have seen a minor spike over the past few weeks thanks to players buying for the RCs, but that will be over soon. I'd advise a short-term inventory reduction and look to restock once prices bottom out in a month or two. Modern Horizons 3 is coming this summer and will lead to another buying spree, so prepare for the long-term.
