
Are you a Quiet Speculation member?
If not, now is a perfect time to join up! Our powerful tools, breaking-news analysis, and exclusive Discord channel will make sure you stay up to date and ahead of the curve.
Time to close the books on 2023. It's been quite a year. We saw two of the biggest sustained warps in Modern's history, banned and restricted policy reverted to an earlier form, and we had the first unban since 2019.
As 2024 begins, Modern is looking to recover from its tumult, but that isn't going to happen right away.
They're Still Here
I was hoping that the latest bans were the end of Modern's statistical outliers. This is not the case. Both the paper and Magic Online (MTGO) results have outliers. The culprit online is Yawgmoth, while paper's problem child is Temur Rhinos.
That Yawgmoth is an outlier isn't entirely surprising given the context. MTGO's smaller player base is legendarily sharky, which combines to create the perfect situation for metagaming and groupthink to take over. The chatter I heard immediately following the ban was that Yawgmoth was about to be unleashed as the best deck in Modern. It was played in high numbers immediately thereafter, and thus the prophecy self-fulfilled.
As for Rhinos, that's a statistical mystery. I knew that Yawgmoth was going to be an outlier before I did the tests. It was quite obvious. However, paper's data didn't look like it would produce an outlier. I was shocked but that's what due diligence is for. That said, I don't think that Rhinos is a typical outlier. There are a lot of gaps in the data that make it weirdly skewed and broken. I think that those gaps warped the stats enough to produce the outlier.
As always, statistical outliers are removed from the analysis but are reported on their correct position on the tier list.
December Population Metagame
To make the tier list, a given deck has to beat the overall average population for the month. The average is my estimate for how many results a given deck "should" produce in a given month. Being a tiered deck requires being better than "good enough". Every deck that posts at least the average number of results is "good enough" and makes the tier list.
Then we go one standard deviation (STdev) above average to set the limit of Tier 3 and the cutoff for Tier 2. This mathematically defines Tier 3 as those decks clustered near the average. Tier 2 goes from the cutoff to the next standard deviation. These are decks that perform well above average. Tier 1 consists of those decks at least two standard deviations above the mean result, encompassing the truly exceptional performing decks.
The MTGO data nearly exclusively comes from official Preliminary and Challenge results. Leagues are excluded, as they are curated lists and thus invalid. The paper data comes from any source I can find, with all reported events being counted.
While the MTGO events report predictable numbers, paper events can report anything from only the winner to all the results. In the latter case, if match results aren't included, I'll take as much of the Top 32 as possible. If match results are reported, I'll take winning record up to Top 32, and then any additional decks tied with 32nd place, as tiebreakers are a magic most foul and black.
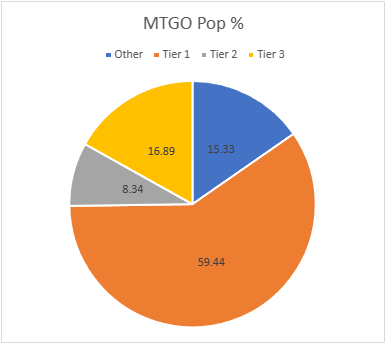
The MTGO Population Data
October's adjusted average population for MTGO was 12.06, setting the Tier 3 cutoff at 12 decks. I always round down if the decimal is less than .20. Tier 3, therefore, begins with decks posting 12 results. The adjusted STdev was 22.97, so add 23 and that means Tier 3 runs to 35 results. Again, it's the starting point to the cutoff, then the next whole number for the next Tier. Therefore Tier 2 starts with 36 results and runs to 59. Subsequently, to make Tier 1, 60 decks are required.
Despite missing out on a weekend of Challenges thanks to the ban, December's population is still up significantly. January 2023 had 840 decks, February had 876, and March had a staggering 1,003 decks. April fell to 949 decks, May plummeted to 770 decks, and June surged to 918, while July topped out at 1086, August fell to 724 decks, and September hit 837 decks, and October hit 935, and November only hit 892. December is up to 959 total decks. The pre-ban events would have put population close to 1200.
However, the high population came with reduced diversity. January had 74 unique decks, February had 84, and March mustered 88. April, May, June had 82 decks, July had 87 decks, August crashed to 71, September was up to 75, October made 78, and November had 88. December has fallen to just 69, with 16 decks on the Tier List.
| Deck Name | Total # | Total % |
|---|---|---|
| Tier 1 | ||
| Yawgmoth | 139 | 14.49 |
| Rakdos Scam | 94 | 9.80 |
| Amulet Titan | 93 | 9.70 |
| UR Murktide | 90 | 9.38 |
| Temur Rhinos | 87 | 9.07 |
| Living End | 67 | 6.99 |
| Tier 2 | ||
| Mono-Green Tron | 43 | 4.48 |
| Coffers | 37 | 3.86 |
| Tier 3 | ||
| Burn | 33 | 3.44 |
| Hardened Scales | 30 | 3.13 |
| Hammer Time | 22 | 2.29 |
| Counter Cat | 17 | 1.77 |
| 4-Color Creativity | 16 | 1.67 |
| UW Control | 16 | 1.67 |
| 4-Color Control | 16 | 1.67 |
| Merfolk | 12 | 1.25 |
While there are going to be some egregious knee-jerk reactions to this data, I'll argue that this isn't to be taken seriously. MTGO's penchant for chasing its own tail notwithstanding, December also enjoyed a Mythic Token holiday event. Diversity always falls during these, defying my expectations. The tale of the tape clearly shows that when given the opportunity to play anything, most players won't experiment and instead only play the perceived best decks. There's an economics and/or psychology dissertation in that observation, if anyone's looking.
The other confounding factor is that there were a number of RCQ's and Super Qualifiers on MTGO this month. These types of events always feature low diversity as all the sharks gravitate towards known top decks over everything else. If this lower diversity and high concentration continues in January's data, then I'd start to worry, but right now I'll just write it off.
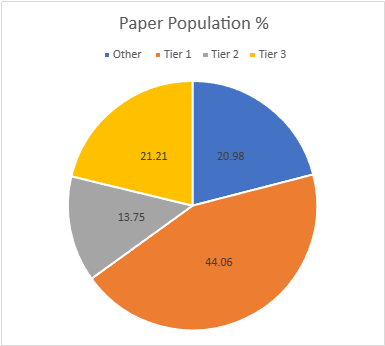
The Paper Population Data
The end of RCQ season and the banning severely impacted paper's population. Fewer events are held in December thanks to the holidays anyway, so losing a weekend of RCQ's really hurt. January saw 667 decks, February up to 807, March hit 962, April plunged to 551, May was up to 581, June was down 547, July surged to 671 decks, and August fell to 558, September hit 775 decks, October had a record 1,102 decks, while November was down to 917 decks. December only has 429, the lowest mark for 2023. Way to end on a whimper.
While in numerical terms, diversity is down in paper, in relative terms it's up. January had 101 decks, February 108, March just 103, April down to 89, May was up to 102, June and July sat at 79, August made 77, and September hit 82, October recorded 109, with November at just 87. December has 67 unique decks, which is proportionately higher than the rest of the year. The fact that it's almost the same mark as MTGO's is a scathing indictment of the online players. Tiered decks fell inconsequentially from 18 to 17. The adjusted average population was 5.8, so 6 results make the list. The adjusted STDev was 9.05, so the increment is 9. Therefore, Tier 3 runs from 6 to 15, Tier 2 is 16 to 25, and Tier 1 is 26 and over.
| Deck Name | Total # | Total % |
|---|---|---|
| Tier 1 | ||
| Temur Rhinos | 46 | 10.72 |
| UR Murktide | 39 | 9.09 |
| Amulet Titan | 38 | 8.85 |
| Yawgmoth | 35 | 8.16 |
| Living End | 31 | 7.23 |
| Tier 2 | ||
| MG Tron | 22 | 5.13 |
| Hammer Time | 19 | 4.43 |
| Merfolk | 18 | 4.20 |
| Tier 3 | ||
| Burn | 15 | 3.50 |
| Rakdos Scam | 14 | 3.26 |
| Hardened Scales | 13 | 3.03 |
| Coffers | 10 | 2.33 |
| Counter Cat | 10 | 2.33 |
| 4-Color Control | 9 | 2.10 |
| UW Control | 7 | 1.63 |
| Jund Saga | 7 | 1.63 |
| 4-Color Creativity | 6 | 1.40 |
October Power Metagame
Tracking the metagame in terms of population is standard practice. But how do results actually factor in? Better decks should also have better results. In an effort to measure this, I use a power ranking system in addition to the prevalence list. By doing so, I measure the relative strengths of each deck within the metagame so that a deck that just squeaks into Top 32 isn't valued the same as one that Top 8's. This better reflects metagame potential.
For the MTGO data, points are awarded based on the population of the event. Preliminaries award points based on record (1 for 3 wins, 2 for 4 wins, 3 for 5), and Challenges are scored 3 points for the Top 8, 2 for Top 16, and 1 for Top 32. If I can find them, non-Wizards events will be awarded points the same as Challenges or Preliminaries depending on what the event in question reports/behaves like. Super Qualifiers and similar higher-level events get an extra point and so do other events if they’re over 200 players, with a fifth point for going over 400 players.
Due to paper reporting being inconsistent and frequently full of data gaps compared to MTGO, its points work differently. I award points based on the size of the tournament rather than placement. For events with no reported starting population or up to 32 players, one point is awarded to every deck. Events with 33 players up to 128 players get two points. From 129 players up to 512 players get three. Above 512 is four points, and five points will be reserved for Modern Pro Tours.
The MTGO Power Tiers
As with population, total points are up, from 1436 in November to 1528 in December. Multiple 4-point events will do that. The adjusted average points were 19.01, therefore 19 points made Tier 3. The adjusted STDev was 37.82, so add 38 to the starting point, and Tier 3 runs to 57 points. Tier 2 starts with 58 points and runs to 96. Tier 1 requires at least 97 points.
| Deck Name | Total Points | Total % |
|---|---|---|
| Tier 1 | ||
| Yawgmoth | 235 | 15.38 |
| Rakdos Scam | 170 | 11.13 |
| Amulet Titan | 161 | 10.54 |
| Temur Rhinos | 143 | 9.36 |
| UR Murktide | 131 | 8.57 |
| Living End | 98 | 6.41 |
| Tier 2 | ||
| Mono-Green Tron | 74 | 4.84 |
| Tier 3 | ||
| Burn | 55 | 3.60 |
| Coffers | 51 | 3.34 |
| Hardened Scales | 48 | 3.14 |
| Hammer Time | 29 | 1.90 |
| Counter Cat | 24 | 1.57 |
| UW Control | 24 | 1.57 |
| 4-Color Control | 22 | 1.44 |
| 4-Color Creativity | 20 | 1.31 |
| Merfolk | 20 | 1.31 |
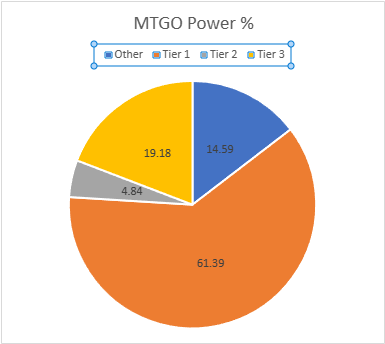
While the rest of MTGO's players flock towards the extremes, Tron just keeps Tronning along. Can't help but respect them.
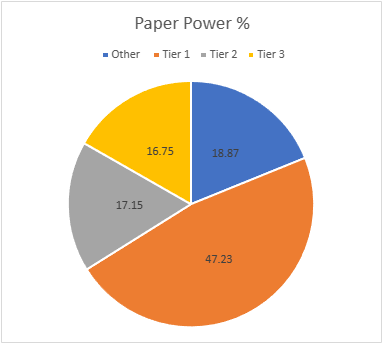
The Paper Power Tiers
As with the population, paper's points fell considerably. November had 1724, but December only hit 758. Only one weekend of RCQ's and few big events. The adjusted average points were 10.17, setting the cutoff at 10 points. The STDev was 17.12, thus adding 17 to the starting point and Tier 3 runs to 27 points. Tier 2 starts with 28 points and runs to 45. Tier 1 requires at least 46 points. 4-Color Creativity fell off from the population tier and wasn't replaced.
| Deck Name | Total Points | Total % |
|---|---|---|
| Tier 1 | ||
| Temur Rhinos | 87 | 11.48 |
| Amulet Titan | 75 | 9.89 |
| UR Murktide | 70 | 9.23 |
| Yawgmoth | 63 | 8.31 |
| Living End | 63 | 8.31 |
| Tier 2 | ||
| MG Tron | 41 | 5.41 |
| Hammer Time | 30 | 3.96 |
| Merfolk | 30 | 3.96 |
| Burn | 29 | 3.83 |
| Tier 3 | ||
| Rakdos Scam | 25 | 3.30 |
| Hardened Scales | 22 | 2.90 |
| Counter Cat | 22 | 2.90 |
| Coffers | 17 | 2.24 |
| 4-Color Control | 17 | 2.24 |
| UW Control | 14 | 1.85 |
| Jund Saga | 10 | 1.32 |
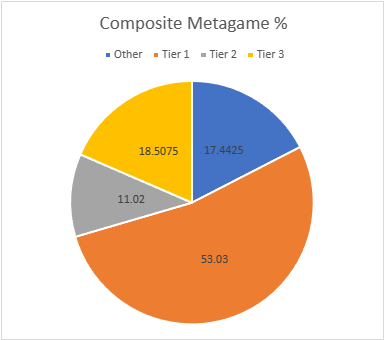
Composite Metagame
That's a lot of data, but what does it all mean? When Modern Nexus was first started, we had a statistical method to combine the MTGO and paper data, but the math of that system doesn't work without big paper events. I tried. Instead, I'm using an averaging system to combine the data. I take the MTGO results and average the tier, then separately average the paper results, then average the paper and MTGO results together for final tier placement.
This generates a lot of partial Tiers. That's not a bug, but a feature. The nuance separates the solidly Tiered decks from the more flexible ones and shows the true relative power differences between the decks. Every deck in the paper and MTGO results is on the table, and when they don't appear in a given category, they're marked N/A. This is treated as a 4 for averaging purposes.
| Deck Name | MTGO Pop Tier | MTGO Power Tier | MTGO Average Tier | Paper Pop Tier | Paper Power Tier | Paper Average Tier | Composite Tier |
|---|---|---|---|---|---|---|---|
| Yawgmoth | 1 | 1 | 1 | 1 | 1 | 1 | 1.00 |
| Amulet Titan | 1 | 1 | 1 | 1 | 1 | 1 | 1.00 |
| UR Murktide | 1 | 1 | 1 | 1 | 1 | 1 | 1.00 |
| Temur Rhinos | 1 | 1 | 1 | 1 | 1 | 1 | 1.00 |
| Living End | 1 | 1 | 1 | 1 | 1 | 1 | 1.00 |
| Rakdos Scam | 1 | 1 | 1 | 3 | 3 | 3 | 2.00 |
| Mono-Green Tron | 2 | 2 | 2 | 2 | 2 | 2 | 2.00 |
| Hammer Time | 3 | 3 | 3 | 2 | 2 | 2 | 2.50 |
| Merfolk | 3 | 3 | 3 | 2 | 2 | 2 | 2.50 |
| Coffers | 2 | 3 | 2.5 | 3 | 3 | 3 | 2.75 |
| Burn | 3 | 3 | 3 | 3 | 2 | 2.5 | 2.75 |
| Hardened Scales | 3 | 3 | 3 | 3 | 3 | 3 | 3.00 |
| Counter Cat | 3 | 3 | 3 | 3 | 3 | 3 | 3.00 |
| 4-Color Creativity | 3 | 3 | 3 | 3 | 3 | 3 | 3.00 |
| UW Control | 3 | 3 | 3 | 3 | 3 | 3 | 3.00 |
| 4-Color Control | 3 | 3 | 3 | 3 | 3 | 3 | 3.00 |
| Jund Saga | N/A | N/A | N/A | 3 | N/A | 3.5 | 3.75 |
Average Power Rankings
Finally, we come to the average power rankings. These are found by taking the total points earned and dividing them by total decks, to measure points per deck. I use this to measure strength vs. popularity. Measuring deck strength is hard. There is no Wins-Above-Replacement metric for Magic, and I'm not certain that one could be credibly devised. The game is too complex, and even then, power is very contextual.
Using the power rankings certainly helps and serves to show how justified a deck’s popularity is. However, more popular decks will still necessarily earn a lot of points. Therefore, the top tier doesn't move much between population and power and obscures whether its decks really earned their position.
This is where the averaging comes in. Decks that earn a lot of points because they get a lot of results will do worse than decks that win more events, indicating which deck actually performs better.
A higher average indicates lots of high finishes, whereas low averages result from mediocre performances and a high population. Lower-tier decks typically do very well here, likely due to their pilots being enthusiasts. Bear this in mind and be careful about reading too much into these results. However, as a general rule, decks that place above the baseline average are over-performing, and vice versa.
How far above or below that average a deck sits justifies its position on the power tiers. Decks well above baseline are undervalued, while decks well below baseline are very popular, but aren't necessarily good.
The Real Story
When considering the average points, the key is looking at how far off a deck is from the Baseline stat (the overall average of points/population). The closer a deck’s performance to the Baseline, the more likely it is to be performing close to its "true" potential.
A deck that is exactly average would therefore perform exactly as well as expected. The greater the deviation from the average, the more a deck under or over-performs. On the low end, a deck’s placing was mainly due to population rather than power, which suggests it’s overrated. A high-scoring deck is the opposite of this.
I'll begin with the averages for MTGO:
| Deck Name | Average Points | Power Tier |
|---|---|---|
| Rakdos Scam | 1.81 | 1 |
| Amulet Titan | 1.73 | 1 |
| Mono-Green Tron | 1.72 | 2 |
| Yawgmoth | 1.69 | 1 |
| Burn | 1.67 | 3 |
| Merfolk | 1.67 | 3 |
| Temur Rhinos | 1.64 | 1 |
| Hardened Scales | 1.60 | 3 |
| Baseline | 1.52 | |
| UW Control | 1.50 | 3 |
| Living End | 1.46 | 1 |
| UR Murktide | 1.45 | 1 |
| Counter Cat | 1.41 | 3 |
| Coffers | 1.38 | 3 |
| 4-Color Control | 1.38 | 3 |
| Hammer Time | 1.32 | 3 |
| 4-Color Creativity | 1.25 | 3 |
Rakdos Scam has been depowered, but apparently the Challenge players still really love the deck as it takes home MTGO Deck of December. Impressive, though quite annoying.
Now the paper averages:
| Deck Name | Average Points | Power Tier |
|---|---|---|
| Counter Cat | 2.20 | 3 |
| Living End | 2.03 | 1 |
| UW Control | 2.00 | 3 |
| Amulet Titan | 1.97 | 1 |
| Burn | 1.93 | 2 |
| Temur Rhinos | 1.89 | 1 |
| 4-Color Control | 1.89 | 3 |
| MG Tron | 1.86 | 2 |
| Yawgmoth | 1.80 | 1 |
| UR Murktide | 1.79 | 1 |
| Rakdos Scam | 1.78 | 3 |
| Coffers | 1.70 | 3 |
| Hardened Scales | 1.69 | 3 |
| Merfolk | 1.67 | 2 |
| Hammer Time | 1.58 | 2 |
| Baseline | 1.54 | |
| Jund Saga | 1.43 | 3 |
Living End made something of a career of winning Paper Deck of the Month during 2023 and finishes the year out strong.
Financial Implications
With the Modern RCQ season ending, some of the demand pressure on Modern staples will be easing. The actual RC in February will keep the prices from falling significantly but be prepared to move if prices start falling. There's been general downward price pressure in the Magic market since late 2022 and nothing in Modern looks to change that trend. Unless a new deck suddenly emerges, which is very unlikely, I expect no shocks until the next set release in February.
Metagame Implications
Modern appears to have stabilized into a familiar pattern, but I think that's deceptive. As previously mentioned, there were a lot of confounding variables in December which lead me to believe that the metagame picture I have is skewed. January will either refute December's conclusions or confirm them, at which point we can start reevaluating.

Rakdos started playing Sheoldred, the Apocalypse as a lesser replacement for Fury. I can’t imagine that it will be nearly as broken as it was before, but the deck is versatile enough that it should continue to see some play.