
Are you a Quiet Speculation member?
If not, now is a perfect time to join up! Our powerful tools, breaking-news analysis, and exclusive Discord channel will make sure you stay up to date and ahead of the curve.
August was... unexpected. Wizards threw everyone off with their Ban Day decisions. Bans were expected in Standard (based on Wizards' own statements) and hoped for in multiple other formats. Instead, Modern and Legacy saw unbans. The impact this has had will be on display in this metagame update.
Continuing Outliers
Rakdos Scam remains a clear and unequivocal outlier on Magic Online (MTGO). It is joined there by UR Murktide, which apparently didn't take kindly to being knocked down to the bottom of Tier 1 last month. As you'll see in the data, there was never really any doubt.
In paper, Scam remains an outlier, but just barely. It just crossed the statistical line to qualify, which is a bit odd as paper has a ridiculously long tail in August. Singleton deck always make up the largest chunk of the population, usually up to a third of results. 48% of paper's entries were singletons in August, which is incredibly high. It was only 29% on MTGO.
As always, outliers are reported in their correct place on the metagame charts but were not included in the statistical analysis.
August Population Metagame
To make the tier list, a given deck has to beat the overall average population for the month. The average is my estimate for how many results a given deck "should" produce in a given month. Being a tiered deck requires being better than "good enough". Every deck that posts at least the average number of results is "good enough" and makes the tier list.
Then we go one standard deviation (STdev) above average to set the limit of Tier 3 and the cutoff for Tier 2. This mathematically defines Tier 3 as those decks clustered near the average. Tier 2 goes from the cutoff to the next standard deviation. These are decks that perform well above average. Tier 1 consists of those decks at least two standard deviations above the mean result, encompassing the truly exceptional performing decks.
The MTGO data nearly exclusively comes from official Preliminary and Challenge results. Leagues are excluded, as they are curated lists and thus invalid. The paper data comes from any source I can find, with all reported events being counted.
While the MTGO events report predictable numbers, paper events can report anything from only the winner to all the results. In the latter case, if match results aren't included, I'll take as much of the Top 32 as possible. If match results are reported, I'll take winning record up to Top 32, and then any additional decks tied with 32nd place, as tiebreakers are a magic most foul and black.
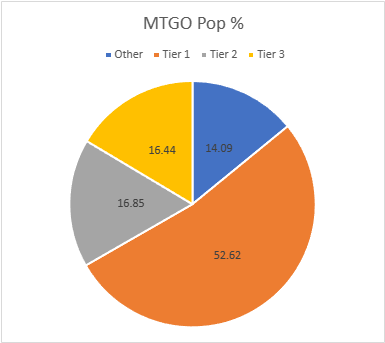
The MTGO Population Data
In August, the adjusted average population for MTGO was 7.59, setting the Tier 3 cutoff at 8 decks. I always round down if the decimal is less than .20. Tier 3, therefore, begins with decks posting 8 results. The adjusted STdev was 10.65, so add 11 and that means Tier 3 runs to 19 results. Again, it's the starting point to the cutoff, then the next whole number for the next Tier. Therefore Tier 2 starts with 20 results and runs to 31. Subsequently, to make Tier 1, 32 decks are required.
August reversed the upward trend in the population. January 2023 had 840 decks, February had 876, and March had a staggering 1,003 decks. April fell to 949 decks, May plummeted to 770 decks, and June surged to 918, while July toped them all with 1086 decks. August fell to 724 decks, the lowest mark this year.
The cause was fewer extra events and smaller Preliminaries, but the unbanning was also a factor. I decided to treat the unban the same as I would a banning and threw out the pre-August 7th data. That said, even if I hadn't, the population numbers would still be down considerably.
A smaller population means less diversity. January had 74 unique decks, February had 84, and March mustered 88. April, May, and June had 82 decks. July it 87 decks, while August had just 71. Of the 71 decks, 21 still made the population tier, same as July. Whether this is a sign of evolution or just how restricted the July metagame was is up for debate.
| Deck Name | Total # | Total % |
|---|---|---|
| Tier 1 | ||
| Rakdos Scam | 112 | 15.47 |
| UR Murktide | 88 | 12.15 |
| Temur Rhinos | 46 | 6.35 |
| Burn | 39 | 5.39 |
| Hammer Time | 32 | 4.42 |
| Yawgmoth | 32 | 4.42 |
| Amulet Titan | 32 | 4.42 |
| Tier 2 | ||
| Jund Saga | 30 | 4.14 |
| 4-Color Control | 25 | 3.45 |
| UB Murktide | 24 | 3.31 |
| Mono-Green Tron | 22 | 3.04 |
| Living End | 22 | 2.90 |
| Tier 3 | ||
| 4-Color Rhinos | 17 | 2.35 |
| Counter Cat | 16 | 2.21 |
| 4-Color Creativity | 15 | 2.07 |
| UW Control | 15 | 2.07 |
| Grixis Shadow | 14 | 1.93 |
| Izzet Prowess | 12 | 1.66 |
| Mill | 11 | 1.52 |
| Coffers | 10 | 1.38 |
| UW Urzablade | 9 | 1.24 |
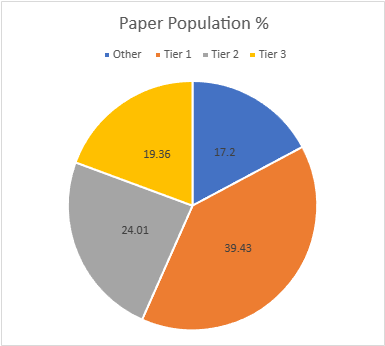
The Paper Population Data
Meanwhile in paper, January saw 667 decks, February up to 807, March hit 962, April plunged to 551, May was up to 581, June was down 547, July surged to 671 decks, and August fell considerably to 558. No Pro Tour or Star City Games events were contributing factors, but I saw very few events reporting more than the Top 8 in August. That's just how it is with the paper data.
Lower population equals lower deck diversity, but not much lower. January had 101 decks, February 108, March just 103, April down to 89, May was up to 102, June and July sat at 79, while August made 77. Only 19 decks made the tier list, down slightly just like the diversity. The adjusted average population was 6.55, so seven decks make Tier 3. The adjusted STDev was 10.69, so the increment is 11. Therefore, Tier 3 runs from 7 to 18, Tier 2 is 19 to 30, and Tier 1 is 31 and over.
| Deck Name | Total # | Total % |
|---|---|---|
| Tier 1 | ||
| Rakdos Scam | 60 | 10.75 |
| Temur Rhinos | 51 | 9.14 |
| Mono-Green Tron | 41 | 7.35 |
| Burn | 37 | 6.63 |
| 4-Color Control | 31 | 5.56 |
| Tier 2 | ||
| Hammer Time | 30 | 5.38 |
| Living End | 28 | 5.02 |
| Amulet Titan | 28 | 5.02 |
| UR Murktide | 24 | 4.30 |
| Jund Saga | 24 | 4.30 |
| Tier 3 | ||
| Yawgmoth | 17 | 3.05 |
| Grixis Shadow | 14 | 2.51 |
| UB Murktide | 14 | 2.51 |
| 4-Color Creativity | 13 | 2.33 |
| Merfolk | 13 | 2.33 |
| UW Control | 11 | 1.97 |
| Hardened Scales | 11 | 1.97 |
| Coffers | 8 | 1.43 |
| Jeskai Combo Breach | 7 | 1.25 |
August Power Metagame
Tracking the metagame in terms of population is standard practice. But how do results actually factor in? Better decks should also have better results. In an effort to measure this, I use a power ranking system in addition to the prevalence list. By doing so, I measure the relative strengths of each deck within the metagame so that a deck that just squeaks into Top 32 isn't valued the same as one that Top 8's. This better reflects metagame potential.
For the MTGO data, points are awarded based on the population of the event. Preliminaries award points based on record (1 for 3 wins, 2 for 4 wins, 3 for 5), and Challenges are scored 3 points for the Top 8, 2 for Top 16, and 1 for Top 32. If I can find them, non-Wizards events will be awarded points the same as Challenges or Preliminaries depending on what the event in question reports/behaves like. Super Qualifiers and similar higher-level events get an extra point and so do other events if they’re over 200 players, with a fifth point for going over 400 players.
Due to paper reporting being inconsistent and frequently full of data gaps compared to MTGO, its points work differently. I award points based on the size of the tournament rather than placement. For events with no reported starting population or up to 32 players, one point is awarded to every deck. Events with 33 players up to 128 players get two points. From 129 players up to 512 players get three. Above 512 is four points, and five points will be reserved for Modern Pro Tours.
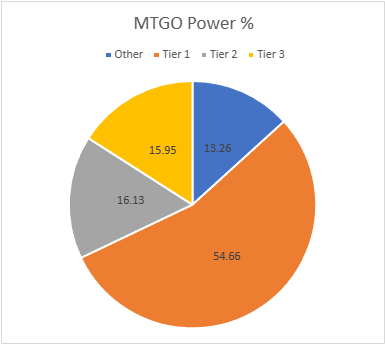
The MTGO Power Tiers
A lower population necessarily means lower points. Total points fell from 1767 to 1116 in August. The adjusted average points were 11.48, therefore 12 points made Tier 3. The adjusted STDev was 16.61, so add 17 to the starting point, and Tier 3 runs to 29 points. Tier 2 starts with 30 points and runs to 47. Tier 1 requires at least 48 points.
While there was some movement inside the tiers, no deck fell out or moved tier. It would seem that the MTGO players have made up their minds about the viable decks.
| Deck Name | Total Points | Total % |
|---|---|---|
| Tier 1 | ||
| Rakdos Scam | 179 | 16.04 |
| UR Murktide | 145 | 12.99 |
| Temur Rhinos | 76 | 6.81 |
| Burn | 57 | 5.11 |
| Amulet Titan | 54 | 4.84 |
| Yawgmoth | 51 | 4.57 |
| Hammer Time | 48 | 4.30 |
| Tier 2 | ||
| Jund Saga | 45 | 4.03 |
| UB Murktide | 36 | 3.23 |
| 4-Color Control | 35 | 3.14 |
| Mono-Green Tron | 34 | 3.05 |
| Living End | 30 | 2.69 |
| Tier 3 | ||
| 4-Color Rhinos | 28 | 2.51 |
| Counter Cat | 24 | 2.15 |
| 4-Color Creativity | 22 | 1.97 |
| UW Control | 22 | 1.97 |
| Grixis Shadow | 19 | 1.70 |
| Mill | 18 | 1.61 |
| Izzet Prowess | 16 | 1.43 |
| Coffers | 15 | 1.34 |
| UW Urzablade | 14 | 1.25 |
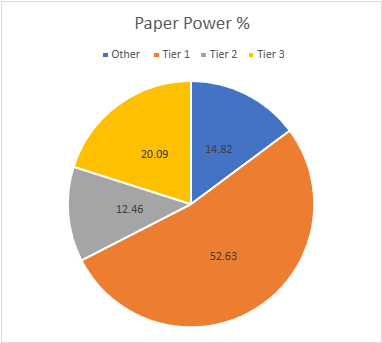
The Paper Power Tiers
As with MTGO, paper's points are down considerably. January had 1178 points, February hit 1316, March shot to 1890, April fell to 964, May hit 1098, June reached 1208, July hit 1428, but August only managed 931. It could never match July's total, but to be the lowest of the year is shocking. The adjusted average points were 10.84, setting the cutoff at 11 points. The STDev was 18.74, thus adding 19 to the starting point and Tier 3 runs to 30 points. Tier 2 starts with 31 points and runs to 50. Tier 1 requires at least 51 points. The number of decks stayed the same, but two decks just jumped from Tier 2 to Tier 1.
| Deck Name | Total Points | Total % |
|---|---|---|
| Tier 1 | ||
| Rakdos Scam | 107 | 11.49 |
| Temur Rhinos | 98 | 10.53 |
| Mono-Green Tron | 68 | 7.30 |
| 4-Color Control | 59 | 6.34 |
| Burn | 56 | 6.01 |
| Hammer Time | 51 | 5.48 |
| Amulet Titan | 52 | 5.48 |
| Tier 2 | ||
| Living End | 42 | 4.51 |
| UR Murktide | 38 | 4.08 |
| Jund Saga | 36 | 3.87 |
| Tier 3 | ||
| Yawgmoth | 30 | 3.22 |
| Grixis Shadow | 28 | 3.01 |
| UB Murktide | 23 | 2.47 |
| Merfolk | 22 | 2.36 |
| 4-Color Creativity | 21 | 2.26 |
| Hardened Scales | 19 | 2.04 |
| Jeskai Combo Breach | 16 | 1.72 |
| UW Control | 14 | 1.50 |
| Coffers | 14 | 1.50 |
Composite Metagame
That's a lot of data, but what does it all mean? When Modern Nexus was first started, we had a statistical method to combine the MTGO and paper data, but the math of that system doesn't work without big paper events. I tried. Instead, I'm using an averaging system to combine the data. I take the MTGO results and average the tier, then separately average the paper results, then average the paper and MTGO results together for final tier placement.
This generates a lot of partial Tiers. That's not a bug, but a feature. The nuance separates the solidly Tiered decks from the more flexible ones and shows the true relative power differences between the decks. Every deck in the paper and MTGO results is on the table, and when they don't appear in a given category, they're marked N/A. This is treated as a 4 for averaging purposes.
| Deck Name | MTGO Pop Tier | MTGO Power Tier | MTGO Average Tier | Paper Pop Tier | Paper Power Tier | Paper Average Tier | Composite Tier |
|---|---|---|---|---|---|---|---|
| Rakdos Scam | 1 | 1 | 1 | 1 | 1 | 1 | 1.00 |
| Temur Rhinos | 1 | 1 | 1 | 1 | 1 | 1 | 1.00 |
| Burn | 1 | 1 | 1 | 1 | 1 | 1 | 1.00 |
| Hammer Time | 1 | 1 | 1 | 2 | 1 | 1.5 | 1.25 |
| Amulet Titan | 1 | 1 | 1 | 2 | 1 | 1.5 | 1.25 |
| UR Murktide | 1 | 1 | 1 | 2 | 2 | 2 | 1.50 |
| 4-Color Control | 2 | 2 | 2 | 1 | 1 | 1 | 1.50 |
| Mono-Green Tron | 2 | 2 | 2 | 1 | 1 | 1 | 1.50 |
| Yawgmoth | 1 | 1 | 1 | 3 | 3 | 3 | 2.00 |
| Jund Saga | 2 | 2 | 2 | 2 | 2 | 2 | 2.00 |
| Living End | 2 | 2 | 2 | 2 | 2 | 2 | 2.00 |
| UB Murktide | 2 | 2 | 2 | 3 | 3 | 3 | 2.50 |
| 4-Color Creativity | 3 | 3 | 3 | 3 | 3 | 3 | 3.00 |
| UW Control | 3 | 3 | 3 | 3 | 3 | 3 | 3.00 |
| Grixis Shadow | 3 | 3 | 3 | 3 | 3 | 3 | 3.00 |
| Coffers | 3 | 3 | 3 | 3 | 3 | 3 | 3.00 |
| 4-Color Rhinos | 3 | 3 | 3 | N/A | N/A | N/A | 3.50 |
| Counter Cat | 3 | 3 | 3 | N/A | N/A | N/A | 3.50 |
| Izzet Prowess | 3 | 3 | 3 | N/A | N/A | N/A | 3.50 |
| Mill | 3 | 3 | 3 | N/A | N/A | N/A | 3.50 |
| UW Urzablade | 3 | 3 | 3 | N/A | N/A | N/A | 3.50 |
| Merfolk | N/A | N/A | N/A | 3 | 3 | 3 | 3.50 |
| Hardened Scales | N/A | N/A | N/A | 3 | 3 | 3 | 3.50 |
| Jeskai Combo Breach | N/A | N/A | N/A | 3 | 3 | 3 | 3.50 |
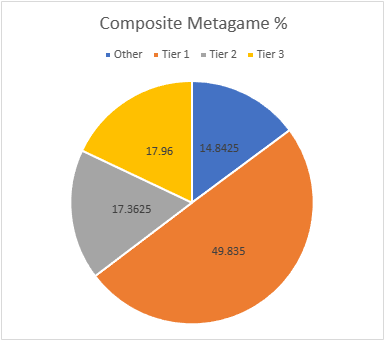
It's strange to consider, but the number of Tier 1 decks fell in August. There were seven pure Tier 1's in July plus two in partial tiers compared to August's three pure Tier 1's and five partials. Whether this is an anomaly or represents a narrowing of the metagame is too early to say.
Average Power Rankings
Finally, we come to the average power rankings. These are found by taking the total points earned and dividing them by total decks, to measure points per deck. I use this to measure strength vs. popularity. Measuring deck strength is hard. There is no Wins-Above-Replacement metric for Magic, and I'm not certain that one could be credibly devised. The game is too complex, and even then, power is very contextual.
Using the power rankings certainly helps and serves to show how justified a deck’s popularity is. However, more popular decks will still necessarily earn a lot of points. Therefore, the top tier doesn't move much between population and power and obscures whether its decks really earned their position.
This is where the averaging comes in. Decks that earn a lot of points because they get a lot of results will do worse than decks that win more events, indicating which deck actually performs better.
A higher average indicates lots of high finishes, whereas low averages result from mediocre performances and a high population. Lower-tier decks typically do very well here, likely due to their pilots being enthusiasts. Bear this in mind and be careful about reading too much into these results. However, as a general rule, decks that place above the baseline average are over-performing, and vice versa.
How far above or below that average a deck sits justifies its position on the power tiers. Decks well above baseline are undervalued, while decks well below baseline are very popular, but aren't necessarily good.
The Real Story
When considering the average points, the key is looking at how far off a deck is from the Baseline stat (the overall average of points/population). The closer a deck’s performance to the Baseline, the more likely it is to be performing close to its "true" potential.
A deck that is exactly average would therefore perform exactly as well as expected. The greater the deviation from the average, the more a deck under or over-performs. On the low end, a deck’s placing was mainly due to population rather than power, which suggests it’s overrated. A high-scoring deck is the opposite of this.
I'll begin with the averages for MTGO:
| Deck Name | Average Points | Power Tier |
|---|---|---|
| Amulet Titan | 1.69 | 1 |
| UR Murktide | 1.65 | 1 |
| Temur Rhinos | 1.65 | 1 |
| 4-Color Rhinos | 1.65 | 3 |
| Mill | 1.64 | 3 |
| Rakdos Scam | 1.60 | 1 |
| Yawgmoth | 1.59 | 1 |
| UW Urzablade | 1.56 | 3 |
| Mono-Green Tron | 1.54 | 2 |
| Hammer Time | 1.50 | 1 |
| Jund Saga | 1.50 | 2 |
| UB Murktide | 1.50 | 2 |
| Counter Cat | 1.50 | 3 |
| Coffers | 1.50 | 3 |
| Baseline | 1.49 | |
| 4-Color Creativity | 1.47 | 3 |
| UW Control | 1.47 | 3 |
| Burn | 1.46 | 1 |
| Living End | 1.43 | 2 |
| 4-Color Control | 1.40 | 2 |
| Grixis Shadow | 1.36 | 3 |
| Izzet Prowess | 1.33 | 3 |
In an unexpected move, as the top placing Tier 1 deck, Amulet Titan is the MTGO Deck of August. It's also the best overall performer which has never happened before. It's usually a Tier 3 on top.
Now the paper averages:
| Deck Name | Average Points | Power Tier |
|---|---|---|
| Jeskai Combo Breach | 2.28 | 3 |
| Grixis Shadow | 2.00 | 3 |
| Temur Rhinos | 1.92 | 1 |
| 4-Color Control | 1.90 | 1 |
| Amulet Titan | 1.82 | 1 |
| Rakdos Scam | 1.78 | 1 |
| Yawgmoth | 1.76 | 3 |
| Coffers | 1.75 | 3 |
| Hardened Scales | 1.72 | 3 |
| Hammer Time | 1.70 | 1 |
| Merfolk | 1.69 | 3 |
| Mono-Green Tron | 1.66 | 1 |
| UB Murktide | 1.64 | 3 |
| 4-Color Creativity | 1.61 | 3 |
| UR Murktide | 1.58 | 2 |
| Burn | 1.51 | 1 |
| Living End | 1.50 | 2 |
| Jund Saga | 1.50 | 2 |
| Baseline | 1.41 | |
| UW Control | 1.27 | 3 |
Meanwhile in paper, Temur Rhinos is Deck of <Month> for the second time in a row. This might be hangover from July, or it could be indicative of the upcoming RCQ season.
Analysis
The first month post-Preordain unban gives a mixed review on its impact. Wizards specifically mentioned wanting to boost UR Murktide after it fell off thanks to Orcish Bowmasters. That's worked on MTGO, where it moved from the bottom of Tier 1 to being an outlier. Again. However, it did nothing for UB Murktide online, and both Murktide decks continue to fall in paper.
Indeed, across the board the impact of Preordain is quite muted. Many decks have adopted Preordain, and players are quite thrilled to have it available. However, Preordain decks aren't doing measurably better in August than in July, according to my data. This isn't entirely surprising, as when I tested Preordain years ago I concluded that it was fine for Modern and not much better than Sleight of Hand.
It is possible that this will change in September. The Modern RCQ season may drive innovation and discovery, which could in turn cause a shakeup. There will be some impact from Wilds of Eldraine (WOE) to consider as well. However, it is equally possible that players just play established decks rather than take the risk with something new. We have to wait and see.
Market Movements
The headline card in WOE is Beseech the Mirror, which should actually be Beseech The One Ring. A tutor that casts cards for the incredibly small price of a food or treasure token is going to see lots of play on the assumption it's busted. I don't know if it actually is or not, but I expect Coffers to see an uptick regardless. Scam is also boosted by Not Dead After All, but that's a comparative drop in the bucket.
The other impact from WOE will be on Urza, Lord High Artificer. Candy Trail is exactly the sort of card that Urza loves, and that fact that it's findable off Urza's Saga is a huge plus. Urza has strongly missed Arcum's Astrolabe, and Candy Trail is as close a replacement as we're ever likely to get. I'd expect an uptick, possibly a strong one.
Other than that, September is the start of Modern RCQ season. Smart investors have already filled their stocks of Modern staples, but there will be opportunities to profit as decks rise and fall in popularity over the next few months. Keep your eyes open.

The drop in competitive decks seems to coincide with the release of serialized Magic. I snatched a few serialized cards myself and it was a buying frenzy. If the players spent most of their budgets collecting cards instead of playing them then it would explain the big drop. Now we know why everybody buys Pokemon but nobody plays it.
I’ve never seen anyone play serialized cards in competitive Magic, and I’m not convinced that the really hardcore competitive players would even consider buying any. Most competitive players. Only buy the singles they need rather than large quantities of cards, so I don’t think there’s been any drop from that crowd.
However, you may be correct about the marginally attached players overspending. Those that will play a tournament if it’s convenient but never grind or travel for them. Those types could well have spent themselves out and so the bulk of players is lower than it used to be. On the other hand, there may just be fewer results overall to report in the first place.