Are you a Quiet Speculation member?
If not, now is a perfect time to join up! Our powerful tools, breaking-news analysis, and exclusive Discord channel will make sure you stay up to date and ahead of the curve.
The first full week of the month is synonymous with the Modern Metagame Update. Or it should be by now, anyway. This is the third year I've been at this without missing an update, and I'd like to think readers are looking forward to it. But sadly for those who did, this is the worst looking metagame I've reported on since companions were errata'd.
About the Title...
Gonna cut to the chase here. The top five, yes five, decks on Magic Online (MTGO) are all statistical outliers. It's actually worse in paper (for once), where the top six decks are outliers. Meaning, they lie far enough outside the trend of the rest of the data that they're not really considered part of the data set. They're deviant. The seventh-ranked paper deck was in the grey, where some tests put it as an outlier, and some don't. Burn was therefore left in the paper analysis, but the outlier decks were removed from the calculations per my long-standing policy.
Without this policy, MTGO would have no Tier 2. There's a huge gap between the outliers and the next best deck, and that coupled with the enormous Standard Deviation meant that there would be a wide Tier 3 and then the outliers in Tier 1.
With so many culprits, it feels like it distorts the data more than removing the outliers. Paper's population tier would have had one deck (Living End) in Tier 2, while Burn fell to Tier 2 based on power. I've had tiny Tier 2s before, but it's never been non-existent. The fact that it could have been says a great deal about the data that you're about to scroll into.
March Population Metagame
To make the tier list, a given deck has to beat the overall average population for the month. The average is my estimate for how many results a given deck "should” produce in a given month. Being a tiered deck requires being better than “good enough.” Every deck that posts at least the average number of results is "good enough" and makes the tier list.
Then we go one standard deviation (STdev) above average to set the limit of Tier 3 and the cutoff for Tier 2. This mathematically defines Tier 3 as those decks clustered near the average. Tier 2 goes from the cutoff to the next standard deviation. These are decks that perform well above average. Tier 1 consists of those decks at least two standard deviations above the mean result, encompassing the truly exceptional performing decks.
The MTGO data nearly exclusively comes from official Preliminary and Challenge results. Leagues are excluded, as they're a curated list and thus invalid. The paper data comes from any source I can find, with all reported events being counted.
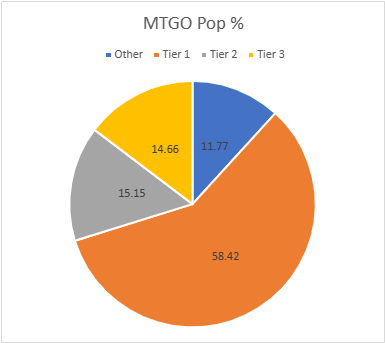
The MTGO Population Data
In March, the adjusted average population for MTGO was 6.48, setting the Tier 3 cutoff at eight decks. Tier 3, therefore, begins with decks posting seven results. The adjusted STdev was 7.73, which means that Tier 3 runs to 15 results. Again, it's the starting point to the cutoff, then the next whole number for the next Tier. Therefore Tier 2 starts with 16 results and runs to 24. Subsequently, to make Tier 1, 25 decks are required. These numbers are all very low compared to most months, but are understandable given the five outliers. They also make sense given the spread of the non-outlier data.
March has set a new record for largest combined data. There were more large Preliminaries and more Challenge level events than normal, fueling the increase. January 2023 had 840 decks, February had 876, and March blows them away with 1,003 decks. I spent 2022 analyzing fewer decks between paper and MTGO combined, making this the most accurate picture of the Modern metagame ever.
That said, the high population didn't translate to more unique decks. That's unsurprising given the outliers. January had 74 unique decks, February had 84, and March only managed 88. That's far below expectations given how high of an increase the population was. Of those 88 decks, 25 made the population tier. Which is up from February's 25 decks, but that was thanks to the outlier adjustment, not the decks performing better.
| Deck Name | Total # | Total % |
|---|---|---|
| Tier 1 | ||
| UR Murktide | 165 | 16.45 |
| 4-Color Creativity | 93 | 9.27 |
| Temur Rhinos | 80 | 7.98 |
| Rakdos Scam | 69 | 6.88 |
| Hammer Time | 64 | 6.38 |
| Burn | 36 | 3.59 |
| Amulet Titan | 28 | 2.79 |
| Izzet Value Breach | 26 | 2.59 |
| Living End | 25 | 2.49 |
| Tier 2 | ||
| Jund Saga | 23 | 2.29 |
| Counter Cat | 20 | 1.99 |
| 4-Color Elementals | 19 | 1.89 |
| Temur Creativity | 19 | 1.89 |
| Yawgmoth | 19 | 1.89 |
| UW Control | 18 | 1.79 |
| Jund Creativity | 18 | 1.79 |
| Izzet Prowess | 16 | 1.59 |
| Tier 3 | ||
| Jeskai Value Breach | 15 | 1.50 |
| Mill | 14 | 1.40 |
| Mono-Green Tron | 14 | 1.40 |
| Hardened Scales | 11 | 1.10 |
| Dredge | 11 | 1.10 |
| Affinity | 11 | 1.10 |
| Mono-Red Moon | 11 | 1.10 |
| 5-Color Creativity | 11 | 1.10 |
| 4-Color Control | 10 | 1.00 |
| Merfolk | 9 | 0.90 |
| Humans | 8 | 0.80 |
| 4-Color Rhinos | 8 | 0.80 |
| Eldrazi Tron | 7 | 0.70 |
| Mono-Blue Tron | 7 | 0.70 |
The five outliers were outliers by quite a wide margin. The unadjusted STDev was 23.59, so the 28-deck gap between Hammer Time and Burn was enough to qualify as an outlier. This is reinforced by the nice trend line of all the nonoutlier decks.
While I can't explain why this happened, I do know how. The top five decks were the primary (sometimes almost only) decks to show up in Challenges. While there were a good mix of decks in Preliminaries, with only Murktide showing up in high numbers, everything outside the top five had to squeeze through the proverbial cracks to make it in the Challenges. I can't say if this was a quirk, MTGO chasing its own tail, or a portent of things to come. We'll get closer to knowing come the April data.
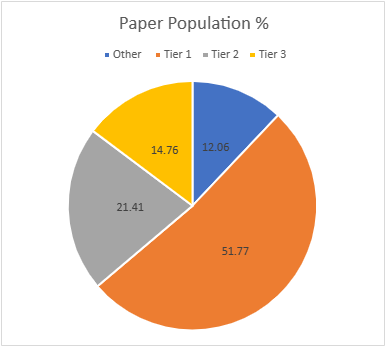
The Paper Population Data
The paper tiers are calculated the same way as the MTGO tiers, just with different data. In most months there are far more reported paper events than online, but paper also tends to report fewer results per event. It's quite annoying, but paper events rarely report more than the Top 8, and far too often for my purposes, the Top 4. This makes the paper data far more variable than MTGO. January saw 667 decks, February is up to 807, and March hit 962. As previously mentioned, this is the largest combined data set I've worked with thanks to a lot more (and larger) events.
The big sample size is somewhat indebted to my decision this year to include more results when able. Paper events often report the actual records alongside decklists. Not always, but often. Thus, I've decided to slightly alter how I take decks when win rates are available. For smaller events, the sometimes means I don't include the full Top 8. For larger events, I'm taking the Top 32 and all the decks with the same record as 32nd place. Tiebreakers are a strange and mysterious alchemy, after all, and may benefit or screw players on a dime.
Again, significantly more decks recorded didn't yield a more diverse dataset. Diversity actually fell. January had 101, February was 108, but March only managed 103. 34 decks made the tier list, which seems high but again is thanks to six outliers. The adjusted average population was 5.84, so six decks make Tier 3. The adjusted STDev was 7.84, so the increment is 8. Therefore, Tier 3 runs from 6 to 14, Tier 2 is 15 to 23, and Tier 1 is 24 and over.
| Deck Name | Total # | Total % |
|---|---|---|
| Tier 1 | ||
| UR Murktide | 87 | 9.04 |
| 4-Color Creativity | 79 | 8.21 |
| Rakdos Scam | 70 | 7.28 |
| Hammer Time | 57 | 5.92 |
| Temur Rhinos | 54 | 5.61 |
| Amulet Titan | 52 | 5.40 |
| Burn | 46 | 4.78 |
| Living End | 28 | 2.91 |
| Merfolk | 25 | 2.60 |
| Tier 2 | ||
| 4-Color Elementals | 23 | 2.39 |
| Yawgmoth | 23 | 2.39 |
| UW Control | 21 | 2.18 |
| Jund Creativity | 20 | 2.08 |
| Izzet Prowess | 19 | 1.98 |
| 4-Color Rhinos | 18 | 1.87 |
| Mono-Green Tron | 18 | 1.87 |
| Jeskai Combo Breach | 17 | 1.77 |
| 4-Color Blink | 17 | 1.77 |
| Jund Saga | 15 | 1.56 |
| Counter Cat | 15 | 1.56 |
| Tier 3 | ||
| Mill | 14 | 1.45 |
| Grixis Death's Shadow | 13 | 1.35 |
| Hardened Scales | 13 | 1.35 |
| Mono-Red Moon | 13 | 1.35 |
| Jeskai Value Breach | 11 | 1.14 |
| Bring to Light | 10 | 1.04 |
| 4-Color Control | 10 | 1.04 |
| Affinity | 10 | 1.04 |
| Death and Taxes | 9 | 0.94 |
| Goryo's Kitchen | 7 | 0.73 |
| Dredge | 7 | 0.73 |
| Domain Zoo | 7 | 0.73 |
| Eldrazi Tron | 6 | 0.62 |
| Mono-Red Artifacts | 6 | 0.62 |
| Humans | 6 | 0.62 |
While the Top 5 decks are the same between MTGO and paper, here they're joined by Amulet Titan. I'm chalking that up to Amulet being weirdly popular on the US east coast, as it shows up in very high numbers in Star City Games events. It doesn't tend to win said events, it just shows up a lot. The reasons for the outliers are the same in paper as online, as the big events were dominated by the Top 5 to the relative exclusion of other decks.
March Power Metagame
Tracking the metagame in terms of population is standard practice. But how do results actually factor in? Better decks should also have better results. In an effort to measure this, I use a power ranking system in addition to the prevalence list. By doing so, I measure the relative strengths of each deck within the metagame.
The population method gives a deck that consistently just squeaks into the Top 32 the same weight as one that Top 8's. Using a power ranking rewards good results and moves the winningest decks to the top of the pile and better reflects their metagame potential.
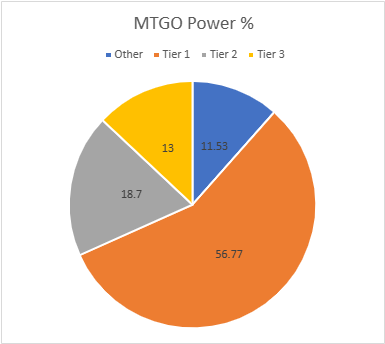
The MTGO Power Tiers
For the MTGO data, points are awarded based on the population of the event. Preliminaries award points based on record (1 for 3 wins, 2 for 4 wins, 3 for 5), and Challenges are scored 3 points for the Top 8, 2 for Top 16, and 1 for Top 32. If I can find them, non-Wizards events will be awarded points the same as Challenges or Preliminaries depending on what the event in question reports/behaves like. Super Qualifiers and similar higher-level events get an extra point and so do other events if they’re over 200 players, with a fifth point for going over 400 players. There were a few 4-point events and no 5-pointer in February.
Total points rose just like the population, from 1412 to 1631. The adjusted average points were 10.37, therefore 11 points made Tier 3. The adjusted STDev was 12.39. Thus add 13 to the starting point and Tier 3 runs to 24 points. Tier 2 starts with 25 points and runs to 38. Tier 1 requires at least 39 points.
Eldrazi Tron fell off the power tier from population. It was replaced by Grixis Shadow.
| Deck Name | Total # | Total % |
|---|---|---|
| Tier 1 | ||
| UR Murktide | 272 | 16.68 |
| 4-Color Creativity | 159 | 9.75 |
| Temur Rhinos | 131 | 8.03 |
| Rakdos Scam | 113 | 6.93 |
| Hammer Time | 106 | 6.50 |
| Burn | 60 | 3.68 |
| Izzet Value Breach | 43 | 2.64 |
| Amulet Titan | 42 | 2.57 |
| Tier 2 | ||
| Jund Saga | 38 | 2.33 |
| Yawgmoth | 35 | 2.15 |
| Counter Cat | 34 | 2.08 |
| Living End | 33 | 2.02 |
| 4-Color Elementals | 31 | 1.90 |
| Temur Creativity | 31 | 1.90 |
| UW Control | 27 | 1.65 |
| Mono-Green Tron | 26 | 1.59 |
| Jund Creativity | 25 | 1.53 |
| Izzet Prowess | 25 | 1.53 |
| Tier 3 | ||
| Jeskai Value Breach | 24 | 1.47 |
| Merfolk | 19 | 1.16 |
| Mill | 18 | 1.10 |
| Mono-Red Moon | 18 | 1.10 |
| Affinity | 17 | 1.04 |
| 4-Color Rhinos | 17 | 1.04 |
| Hardened Scales | 16 | 0.98 |
| Dredge | 16 | 0.98 |
| 5-Color Creativity | 15 | 0.92 |
| Mono-Blue Tron | 15 | 0.92 |
| Humans | 14 | 0.86 |
| 4-Color Control | 12 | 0.74 |
| Grixis Death's Shadow | 11 | 0.67 |
The same trend in the population is apparent in the power tier. Non-Tier 1 decks are really struggling to compete.
The Paper Power Tiers
Due to paper reporting being inconsistent compared to MTGO, I have to adapt how the points work. Applying the MTGO point system just doesn't work when I don't know how many points to award and there are data gaps. Thus, I award points based on the size of the tournament rather than placement. That way I'm being internally consistent with the paper results.
For events with no reported starting population and those up to 32 players, one point is awarded. Events with 33 players up to 128 players gets two points. From 129 players up to 512 players gets three. Above 512 is four points and five points will be reserved for Modern Pro Tours if they ever happen.
March saw the first paper event to qualify for four points, which dramatically raised the point total. January saw 1178 points, February hit 1316, and March has 1890, more points than MTGO. The adjusted average points were 10.95. This sets the cutoff at 11 decks. The STDev was 15.39, thus adding 16 to the starting point and Tier 3 runs to 27 points. Tier 2 starts with 28 points and runs to 44. Tier 1 requires at least 45 points. The total decks rose from 34 to 33 as Domain Zoo couldn't scrape together enough points to remain.
| Deck Name | Total Points | Total % |
|---|---|---|
| Tier 1 | ||
| 4-Color Creativity | 176 | 9.31 |
| UR Murktide | 174 | 9.21 |
| Rakdos Scam | 142 | 7.51 |
| Hammer Time | 121 | 6.40 |
| Temur Rhinos | 115 | 6.08 |
| Amulet Titan | 104 | 5.50 |
| Burn | 89 | 4.71 |
| Living End | 55 | 2.91 |
| 4-Color Elementals | 45 | 2.38 |
| Tier 2 | ||
| UW Control | 44 | 2.33 |
| Yawgmoth | 43 | 2.27 |
| 4-Color Rhinos | 40 | 2.12 |
| Merfolk | 39 | 2.06 |
| Jeskai Combo Breach | 39 | 2.06 |
| Izzet Prowess | 36 | 1.90 |
| 4-Color Blink | 36 | 1.90 |
| Jund Creativity | 35 | 1.85 |
| Mono-Green Tron | 34 | 1.80 |
| Jund Saga | 33 | 1.75 |
| Counter Cat | 29 | 1.53 |
| Tier 3 | ||
| Jeskai Value Breach | 26 | 1.38 |
| Mill | 25 | 1.32 |
| Grixis Death's Shadow | 25 | 1.32 |
| Hardened Scales | 25 | 1.32 |
| Mono-Red Moon | 21 | 1.11 |
| Bring to Light | 21 | 1.11 |
| 4-Color Control | 20 | 1.06 |
| Eldrazi Tron | 16 | 0.85 |
| Affinity | 15 | 0.79 |
| Death and Taxes | 13 | 0.69 |
| Goryo's Kitchen | 12 | 0.63 |
| Dredge | 12 | 0.63 |
| Mono-Red Artifacts | 12 | 0.63 |
| Humans | 12 | 0.63 |
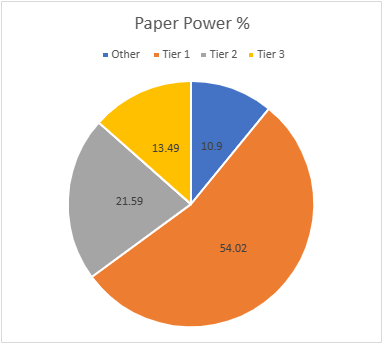
In an unusual twist, 4-Color Creativity actually beat out Murktide for the top slot on power. This isn't surprising given that Murktide's overall win rate is about 50% against everything. It's a very hard deck to pilot well with a high skill ceiling, but also a high floor. Creativity actually gets free wins, so it has always performed better. Given that there's not a huge difference in population this month, it was natural for Creativity to just pip Murktide for the top slot, though statistically they're tied.
Average Power Rankings
Finally, we come to the average power rankings. These are found by taking the total points earned and dividing them by total decks, to measure points per deck. I use this to measure strength vs. popularity. Measuring deck strength is hard. There is no Wins-Above-Replacement metric for Magic, and I'm not certain that one could be credibly devised. The game is too complex, and even then, power is very contextual.
Using the power rankings certainly helps and serves to show how justified a deck’s popularity is. However, more popular decks will still necessarily earn a lot of points. Which tracks, but also means that the top tier doesn't move much between population and power, and obscures whether they really earned their position.
This is where the averaging comes in. Decks that earn a lot of points because they get a lot of results will do worse than decks that win more events, indicating which deck actually performs better. A higher average indicates lots of high finishes, whereas low averages result from mediocre performances and a high population. Lower-tier decks typically do very well here, likely due to their pilots being enthusiasts. Bear this in mind, and be careful about reading too much into these results. However, as a general rule, decks which place above the baseline average are overperforming and vice versa.
How far above or below that average determines how "justified" a deck's position is on the power tiers. Decks well above baseline are therefore undervalued while decks well below baseline are very popular but aren't necessarily good.
The Real Story
When considering the average points, the key is looking at how far-off a deck is from the Baseline stat (the overall average of points/population). The closer a deck’s performance to the Baseline, the more likely it is to be performing close to its “true” potential. A deck that is exactly average would therefore perform exactly as well as expected. The greater the deviation from the average, the more a deck under or over-performs. On the low end, a deck’s placing was mainly due to population rather than power, which suggests it’s overrated. A high-scoring deck is the opposite of this.
I'll begin with the averages for MTGO:
| Deck Name | Average Power | Power Tier |
|---|---|---|
| Mono-Blue Tron | 2.14 | 3 |
| 4-Color Rhinos | 2.13 | 3 |
| Merfolk | 2.11 | 3 |
| Mono-Green Tron | 1.86 | 2 |
| Yawgmoth | 1.84 | 2 |
| Grixis Death's Shadow | 1.83 | 3 |
| Humans | 1.75 | 3 |
| 4-Color Creativity | 1.71 | 1 |
| Counter Cat | 1.70 | 2 |
| Burn | 1.67 | 1 |
| Hammer Time | 1.66 | 1 |
| UR Murktide | 1.65 | 1 |
| Izzet Value Breach | 1.65 | 1 |
| Jund Saga | 1.65 | 2 |
| Temur Rhinos | 1.64 | 1 |
| Rakdos Scam | 1.64 | 1 |
| Mono-Red Moon | 1.64 | 3 |
| 4-Color Elementals | 1.63 | 2 |
| Baseline | 1.63 | |
| Temur Creativity | 1.63 | 2 |
| Jeskai Value Breach | 1.60 | 3 |
| Izzet Prowess | 1.56 | 2 |
| Affinity | 1.54 | 3 |
| Amulet Titan | 1.50 | 1 |
| UW Control | 1.50 | 2 |
| Hardened Scales | 1.45 | 3 |
| Dredge | 1.45 | 3 |
| Jund Creativity | 1.39 | 2 |
| 5-Color Creativity | 1.36 | 3 |
| Living End | 1.32 | 2 |
| Mill | 1.29 | 3 |
| 4-Color Control | 1.20 | 3 |
Congratulations to 4-Color Creativity. As the top performing Tier 1 deck, you're MTGO's Deck of the Month for March.
Now the paper averages:
| Deck Name | Average Points | Power Tier |
|---|---|---|
| Eldrazi Tron | 2.67 | 3 |
| Jeskai Value Breach | 2.36 | 3 |
| Jeskai Combo Breach | 2.29 | 2 |
| 4-Color Creativity | 2.23 | 1 |
| 4-Color Rhinos | 2.22 | 2 |
| Jund Saga | 2.20 | 2 |
| Temur Rhinos | 2.13 | 1 |
| Hammer Time | 2.12 | 1 |
| 4-Color Blink | 2.12 | 2 |
| Bring to Light | 2.10 | 3 |
| UW Control | 2.09 | 2 |
| Rakdos Scam | 2.03 | 1 |
| UR Murktide | 2.00 | 1 |
| Amulet Titan | 2.00 | 1 |
| 4-Color Control | 2.00 | 3 |
| Mono-Red Artifacts | 2.00 | 3 |
| Humans | 2.00 | 3 |
| Living End | 1.96 | 1 |
| 4-Color Elementals | 1.96 | 1 |
| Burn | 1.93 | 1 |
| Counter Cat | 1.93 | 2 |
| Grixis Death's Shadow | 1.92 | 3 |
| Hardened Scales | 1.92 | 3 |
| Izzet Prowess | 1.89 | 2 |
| Mono-Green Tron | 1.89 | 2 |
| Yawgmoth | 1.87 | 2 |
| Mill | 1.79 | 3 |
| Jund Creativity | 1.75 | 2 |
| Baseline | 1.74 | |
| Goryo's Kitchen | 1.71 | 3 |
| Dredge | 1.71 | 3 |
| Mono-Red Moon | 1.61 | 3 |
| Merfolk | 1.56 | 2 |
| Affinity | 1.50 | 3 |
| Death and Taxes | 1.44 | 3 |
Congratulations to 4-Color Creativity. As the top performing Tier 1 deck, you're paper's Deck of the Month for March, too. I think this is the first time this the same deck has been Deck of the Month in both categories since I started doing the averages.
Composite Metagame
That's a lot of data, but what does it all mean? When Modern Nexus was first started, we had a statistical method to combine the MTGO and paper data, but the math of that system doesn't work without big paper events. I tried. Instead, I'm using an averaging system to combine the data. I take the MTGO results and average the tier, then separately average the paper results, then average the paper and MTGO results together for final tier placement.
This generates a lot of partial Tiers. That's not a bug, but a feature. The nuance separates the solidly Tiered decks from the more flexible ones and shows the true relative power differences between the decks. Every deck in the paper and MTGO results is on the table, and when they don't appear in a given category, they're marked N/A. This is treated as a 4 for averaging purposes.
| Deck Name | MTGO Pop Tier | MTGO Power Tier | MTGO Average Tier | Paper Pop Tier | Paper Power Tier | Paper Average Tier | Composite Tier |
|---|---|---|---|---|---|---|---|
| UR Murktide | 1 | 1 | 1 | 1 | 1 | 1 | 1.00 |
| 4-Color Creativity | 1 | 1 | 1 | 1 | 1 | 1 | 1.00 |
| Hammer Time | 1 | 1 | 1 | 1 | 1 | 1 | 1.00 |
| Temur Rhinos | 1 | 1 | 1 | 1 | 1 | 1 | 1.00 |
| Rakdos Scam | 1 | 1 | 1 | 1 | 1 | 1 | 1.00 |
| Burn | 1 | 1 | 1 | 1 | 1 | 1 | 1.00 |
| Amulet Titan | 1 | 1 | 1 | 1 | 1 | 1 | 1.00 |
| Living End | 1 | 2 | 1.5 | 1 | 1 | 1 | 1.25 |
| 4-Color Elementals | 2 | 2 | 2 | 2 | 1 | 1.5 | 1.75 |
| Yawgmoth | 2 | 2 | 2 | 2 | 2 | 2 | 2.00 |
| Counter Cat | 2 | 2 | 2 | 2 | 2 | 2 | 2.00 |
| Jund Saga | 2 | 2 | 2 | 2 | 2 | 2 | 2.00 |
| Izzet Prowess | 2 | 2 | 2 | 2 | 2 | 2 | 2.00 |
| UW Control | 2 | 2 | 2 | 2 | 2 | 2 | 2.00 |
| Jund Creativity | 2 | 2 | 2 | 2 | 2 | 2 | 2.00 |
| 4-Color Rhinos | 3 | 3 | 3 | 2 | 2 | 2 | 2.00 |
| Mono-Green Tron | 3 | 2 | 2.5 | 2 | 2 | 2 | 2.25 |
| Merfolk | 3 | 3 | 3 | 1 | 2 | 1.5 | 2.25 |
| Izzet Value Breach | 1 | 1 | 1 | N/A | N/A | N/A | 2.50 |
| Temur Creativity | 2 | 2 | 2 | N/A | N/A | N/A | 3.00 |
| Humans | 3 | 3 | 3 | 3 | 3 | 3 | 3.00 |
| Mono-Red Moon | 3 | 3 | 3 | 3 | 3 | 3 | 3.00 |
| Jeskai Value Breach | 3 | 3 | 3 | 3 | 3 | 3 | 3.00 |
| Affinity | 3 | 3 | 3 | 3 | 3 | 3 | 3.00 |
| Hardened Scales | 3 | 3 | 3 | 3 | 3 | 3 | 3.00 |
| Dredge | 3 | 3 | 3 | 3 | 3 | 3 | 3.00 |
| Mill | 3 | 3 | 3 | 3 | 3 | 3 | 3.00 |
| 4-Color Control | 3 | 3 | 3 | 3 | 3 | 3 | 3.00 |
| Jeskai Combo Breach | N/A | N/A | N/A | 2 | 2 | 2 | 3.00 |
| 4-Color Blink | N/A | N/A | N/A | 2 | 2 | 2 | 3.00 |
| Grixis Death's Shadow | N/A | 3 | 3.5 | 3 | 3 | 3 | 3.25 |
| Eldrazi Tron | 3 | N/A | 3.5 | 3 | 3 | 3 | 3.25 |
| Mono-Blue Tron | 3 | 3 | 3 | N/A | N/A | N/A | 3.50 |
| 5-Color Creativity | 3 | 3 | 3 | N/A | N/A | N/A | 3.50 |
| Bring to Light | N/A | N/A | N/A | 3 | 3 | 3 | 3.50 |
| Death and Taxes | N/A | N/A | N/A | 3 | 3 | 3 | 3.50 |
| Goryo's Kitchen | N/A | N/A | N/A | 3 | 3 | 3 | 3.50 |
| Mono-Red Artifacts | N/A | N/A | N/A | 3 | 3 | 3 | 3.50 |
| Domain Zoo | N/A | N/A | N/A | 3 | N/A | 3.5 | 3.75 |
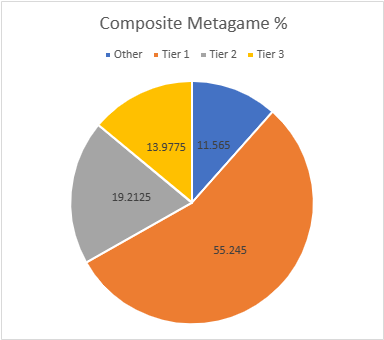
Normally, there are a lot more decks in the partial tiers rather than the full ones, indicating movement and churn in the metagame. The fact that this didn't happen in March indicates stability and possibly stagnation.
Locked In
It is looking increasingly likely that Modern has been locked into a stable equilibrium around Murktide and company. It is going to take either direct action by Wizards or some very powerful cards from March of the Machine to disrupt that stability. I don't like either implication.
As always, this first-of-the-month article merely presents the collected data, offering little in the way of analysis, metagame implications, and financial opportunities. Join me on Friday when I dig into these results and discuss exactly what has my hackles up. These pieces are normally available to Insiders first, but this week's piece is free for all readers. If you like what you read, and you're not an Insider, consider subscribing today!
