
Are you a Quiet Speculation member?
If not, now is a perfect time to join up! Our powerful tools, breaking-news analysis, and exclusive Discord channel will make sure you stay up to date and ahead of the curve.
New month, new metagame update. Not a new metagame, though. As I've been explaining for months now, Modern has settled into an equilibrium. The top of the metagame looks basically the same as it did in March. The rest of the metagame has been in flux, but not of the kind that will actually disturb the overall status quo. I have doubts that anything in the coming months will be able to change things, either.
Confusing Outliers
As has been the case since March 2022, there are outliers in the data. However, the number of outliers is not entirely clear. When I do these calculations, I use a variety of tests which use a variety of methods. Normally, their conclusions are consistent, but that was not the case for April.
For the Magic Online (MTGO) results, tests using the interquartile range (IQR) said that the top five results were definitely outliers, and the next two were on the bubble. Which makes sense, given the data. IQR tests look at the spread and gaps in the data, and it is quite large, though not as bad as last month.
However, tests using the z-statistic said there's no outliers. They're focused on the standard deviation and skew in the data, and while both were large, they weren't as bad as in previous months. The unadjusted MTGO population StDev is 22.80 and kurtosis of 10.30 in April where March had 23.58 and 22.68 respectively.
Thus, the stats aren't clear. I went with the IQR conclusions in order to include more decks on the tier list.
For paper, the results gave a clearer answer, but not a clear reason. All tests agreed that the top result was an outlier. After that, there was no agreement. Some z-tests said that only that top result was an outlier, others said that the top four were outliers. Some IQR tests had four outliers, some had six, some had only one.
I decided to only treat the top result as an outlier as every test agreed that it was, but this stands as a testament to how weird the data is this month. As always, outliers are removed from the tier calculations, resulting in adjusted averages and STDev's. The decks remain in their correct place on the tier list.
April Population Metagame
To make the tier list, a given deck has to beat the overall average population for the month. The average is my estimate for how many results a given deck "should” produce in a given month. Being a tiered deck requires being better than “good enough.” Every deck that posts at least the average number of results is "good enough" and makes the tier list.
Then we go one standard deviation (STdev) above average to set the limit of Tier 3 and the cutoff for Tier 2. This mathematically defines Tier 3 as those decks clustered near the average. Tier 2 goes from the cutoff to the next standard deviation. These are decks that perform well above average. Tier 1 consists of those decks at least two standard deviations above the mean result, encompassing the truly exceptional performing decks.
The MTGO data nearly exclusively comes from official Preliminary and Challenge results. Leagues are excluded, as they are curated lists and thus invalid. The paper data comes from any source I can find, with all reported events being counted.
The MTGO Population Data
In April, the adjusted average population for MTGO was 6.21, setting the Tier 3 cutoff at seven decks. Tier 3, therefore, begins with decks posting seven results. The adjusted STdev was 7.91, which means that Tier 3 runs to 15 results. Again, it's the starting point to the cutoff, then the next whole number for the next Tier. Therefore Tier 2 starts with 16 results and runs to 24. Subsequently, to make Tier 1, 25 decks are required. The stats have changed marginally, but the tier cutoffs are the same as in March. Which makes sense, given the removal of outliers.
April couldn't match the heights of March. Due to fewer events and smaller Preliminaries, the population is down. January 2023 had 840 decks, February had 876, and March had a staggering 1,003 decks. April fell short at 949 decks.
Along with population, diversity is down. January had 74 unique decks, February had 84, March mustered 88, and April hit 82. The fact that April is below February's mark either says a lot about February's diversity or indicates an actual decrease in diversity. Hard to say.
Of the 82 decks, 29 made the population tier. Which is up from March's 25 decks, though again the extreme adjustment is more at fault for that than the metagame.
| Deck Name | Total # | Total % |
|---|---|---|
| Tier 1 | ||
| UR Murktide | 109 | 11.49 |
| 4-Color Creativity | 104 | 10.96 |
| Temur Rhinos | 96 | 10.12 |
| Rakdos Scam | 94 | 9.90 |
| Hammer Time | 68 | 7.16 |
| Living End | 49 | 5.16 |
| Yawgmoth | 30 | 3.16 |
| Tier 2 | ||
| Burn | 22 | 2.32 |
| Amulet Titan | 21 | 2.21 |
| UW Control | 21 | 2.21 |
| Merfolk | 20 | 2.11 |
| Tier 3 | ||
| Bring to Light | 15 | 1.58 |
| Mono-Green Tron | 15 | 1.58 |
| Affinity | 15 | 1.58 |
| Izzet Prowess | 14 | 1.47 |
| Mill | 14 | 1.47 |
| Coffers | 12 | 1.26 |
| Jund Saga | 12 | 1.26 |
| 4-Color Blink | 11 | 1.16 |
| Temur Creativity | 11 | 1.16 |
| Goryo's Kitchen | 10 | 1.05 |
| 4-Color Elementals | 9 | 0.95 |
| 4-Color Control | 9 | 0.95 |
| Counter Cat | 9 | 0.95 |
| Humans | 9 | 0.95 |
| Jeskai Combo Breach | 8 | 0.84 |
| Belcher | 8 | 0.84 |
| Jeskai Value Breach | 7 | 0.74 |
| Mono-Blue Tron | 7 | 0.74 |
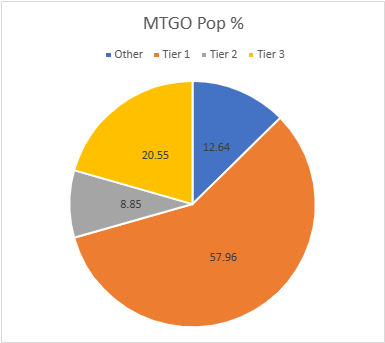
To carry on a point from last week, the 5-deck concentration ratio is up to 49.63. Tier 1 has consistently taken up a huge chunk of the metagame since I started tracking that stat, while in the past it was more evenly distributed between the member decks. Living End and Yawgmoth's contributions are negligible, and that's worrying.
The Paper Population Data
The paper tiers are calculated the same way as the MTGO tiers, just with different data. In most months there are far more reported paper events than online, but paper also tends to report fewer results per event. It's quite annoying, but paper events rarely report more than the Top 8, and far too often for my purposes, only the Top 4. This makes the paper data far more variable than MTGO.
January saw 667 decks, February is up to 807, March hit 962, but April has plunged to 551. There were a number of large events that reported scattered results (not even the full Top 8!) and others are simply missing. Face to Face Games had an open in Montreal last weekend, but I haven't seen any of the data, or even any talk about the event. They're not alone. Tournament Organizers: get it together! We need data!
Paper events often report the actual records alongside decklists. Thus, I've decided to change how I record decks when win rates are available. For smaller events, I take any winning record which sometimes means I don't include the full Top 8. For larger events, I'm taking the Top 32 and all the decks with the same record as 32nd place. Tiebreakers are a strange and mysterious alchemy, after all, and may benefit or screw players on a whim.
That said, significantly fewer decks recorded did yield a significantly less diverse dataset. January had 101, February 108, March just 103, and April 89. That is almost certainly a function of the lower population rather than metagame forces. 24 decks made the tier list, which is low but again makes sense in context. The adjusted average population was 5.58, so six decks make Tier 3. The adjusted STDev was 8.61, so the increment is 9. Therefore, Tier 3 runs from 6 to 15, Tier 2 is 16 to 25, and Tier 1 is 26 and over.
| Deck Name | Total # | Total % |
|---|---|---|
| Tier 1 | ||
| 4-Color Creativity | 60 | 10.89 |
| UR Murktide | 44 | 7.99 |
| Temur Rhinos | 44 | 7.99 |
| Hammer Time | 42 | 7.62 |
| Tier 2 | ||
| Rakdos Scam | 24 | 4.36 |
| Amulet Titan | 22 | 3.99 |
| Burn | 21 | 3.81 |
| Tier 3 | ||
| UW Control | 15 | 2.72 |
| Izzet Prowess | 13 | 2.36 |
| Merfolk | 12 | 2.18 |
| Mono-Green Tron | 11 | 2.00 |
| 4-Color Elementals | 11 | 2.00 |
| Yawgmoth | 11 | 2.00 |
| Jeskai Combo Breach | 10 | 1.81 |
| Goryo Blink | 10 | 1.81 |
| Bring to Light | 10 | 1.81 |
| Boros Moon | 9 | 1.63 |
| Mono-Blue Tron | 9 | 1.63 |
| Counter Cat | 8 | 1.45 |
| Jund Saga | 8 | 1.45 |
| Living End | 7 | 1.27 |
| Ponza | 7 | 1.27 |
| 4-Color Rhinos | 6 | 1.09 |
| Grixis Shadow | 6 | 1.09 |
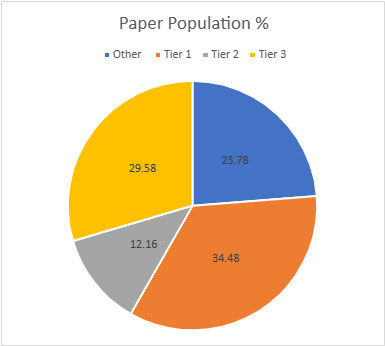
Tier 1 is much smaller in paper than on MTGO. That's good, but I suspect it's down more to the lower population than anything else. That Tier 2 is similarly tiny lends credence to this idea. It is notable that UR Murktide was not the top deck in paper, having been replaced by 4-Color Creativity. However, don't celebrate just yet. The story of how that happened (in paper and MTGO) is a big piece of Friday's analysis article, and the reason for this isn't quite what you'd think.
March Power Metagame
Tracking the metagame in terms of population is standard practice. But how do results actually factor in? Better decks should also have better results. In an effort to measure this, I use a power ranking system in addition to the prevalence list. By doing so, I measure the relative strengths of each deck within the metagame.
The population method gives a deck that consistently just squeaks into the Top 32 the same weight as one that Top 8's. Using a power ranking rewards good results and moves the winningest decks to the top of the pile and better reflects their metagame potential.
The MTGO Power Tiers
For the MTGO data, points are awarded based on the population of the event. Preliminaries award points based on record (1 for 3 wins, 2 for 4 wins, 3 for 5), and Challenges are scored 3 points for the Top 8, 2 for Top 16, and 1 for Top 32. If I can find them, non-Wizards events will be awarded points the same as Challenges or Preliminaries depending on what the event in question reports/behaves like. Super Qualifiers and similar higher-level events get an extra point and so do other events if they’re over 200 players, with a fifth point for going over 400 players. There were a few 4-point events and no 5-pointer in April.
Total points fell just like the population, from 1631 to 1477. The adjusted average points were 9.74, therefore 10 points made Tier 3. The adjusted STDev was 13.33. Add 14 to the starting point and Tier 3 runs to 24 points. Tier 2 starts with 25 points and runs to 39. Tier 1 requires at least 40 points.
Jund Creativity and Niv to Light managed to get onto the power tier through strong Challenge results.
| Deck Name | Total Points | Total % |
|---|---|---|
| Tier 1 | ||
| UR Murktide | 178 | 12.05 |
| 4-Color Creativity | 158 | 10.70 |
| Temur Rhinos | 153 | 10.36 |
| Rakdos Scam | 144 | 9.75 |
| Hammer Time | 94 | 6.36 |
| Living End | 89 | 6.03 |
| Tier 2 | ||
| Yawgmoth | 39 | 2.64 |
| Burn | 37 | 2.50 |
| Amulet Titan | 36 | 2.44 |
| UW Control | 34 | 2.30 |
| Merfolk | 32 | 2.17 |
| Mono-Green Tron | 27 | 1.82 |
| Izzet Prowess | 25 | 1.69 |
| Tier 3 | ||
| Bring to Light | 23 | 1.56 |
| Coffers | 21 | 1.42 |
| Affinity | 20 | 1.35 |
| Mill | 20 | 1.35 |
| Temur Creativity | 19 | 1.29 |
| Jund Saga | 17 | 1.15 |
| 4-Color Elementals | 17 | 1.15 |
| Humans | 16 | 1.08 |
| 4-Color Blink | 15 | 1.02 |
| Goryo's Kitchen | 13 | 0.88 |
| 4-Color Control | 13 | 0.88 |
| Mono-Blue Tron | 12 | 0.81 |
| Jund Creativity | 12 | 0.81 |
| Counter Cat | 11 | 0.74 |
| Jeskai Combo Breach | 11 | 0.74 |
| Belcher | 11 | 0.74 |
| Jeskai Value Breach | 11 | 0.74 |
| Niv to Light | 10 | 0.68 |
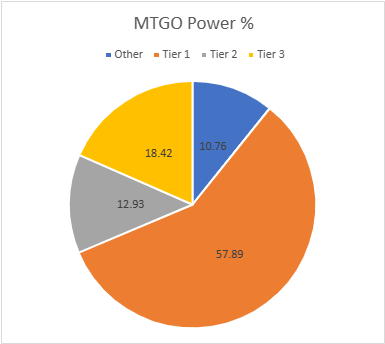
Yawgmoth fell out of Tier 1 because it had a terrible conversion rate. As the average power stat will show, it was present, but not actually winning, a lot of events. Meanwhile, Living End did exceptionally well. It must have been very well positioned, but I don't know enough about its matchups to see how or why it was in April, but no other month. It could also be down to the whims of MTGO's volatile player base.
The Paper Power Tiers
Due to paper reporting being inconsistent compared to MTGO, I have to adapt how the points work. Applying the MTGO point system just doesn't work when I don't know how many points to award and there are data gaps. Thus, I award points based on the size of the tournament rather than placement. That way, I'm being internally consistent with the paper results.
For events with no reported starting population and those up to 32 players, one point is awarded. Events with 33 players up to 128 players gets two points. From 129 players up to 512 players gets three. Above 512 is four points, and five points will be reserved for Modern Pro Tours if they ever happen again.
April saw a number of absurdly large events early on, then started drying up. January saw 1178 points, February hit 1316, and March had 1890, but April clocked in at only 964. The adjusted average points were 9.61. This sets the cutoff at 10 decks. The STDev was 15.76, thus adding 16 to the starting point and Tier 3 runs to 26 points. Tier 2 starts with 27 points and runs to 44. Tier 1 requires at least 44 points. The total decks stayed the same at 24, though Ponza and Jund Saga fell from the list, replaced by 4-Color Blink and Temur Creativity.
| Deck Name | Total Points | Total % |
|---|---|---|
| Tier 1 | ||
| 4-Color Creativity | 118 | 12.24 |
| UR Murktide | 93 | 9.65 |
| Hammer Time | 75 | 7.78 |
| Temur Rhinos | 69 | 7.16 |
| Rakdos Scam | 48 | 4.98 |
| Tier 2 | ||
| Burn | 37 | 3.84 |
| Amulet Titan | 32 | 3.32 |
| UW Control | 27 | 2.80 |
| Tier 3 | ||
| Izzet Prowess | 20 | 2.07 |
| Mono-Green Tron | 20 | 2.07 |
| Merfolk | 19 | 1.97 |
| Jeskai Combo Breach | 19 | 1.97 |
| Bring to Light | 19 | 1.97 |
| 4-Color Elementals | 18 | 1.87 |
| Yawgmoth | 18 | 1.87 |
| Counter Cat | 17 | 1.76 |
| Living End | 17 | 1.76 |
| Goryo Blink | 16 | 1.66 |
| Boros Moon | 12 | 1.24 |
| Grixis Shadow | 12 | 1,24 |
| 4-Color Blink | 12 | 1.24 |
| Temur Creativity | 12 | 1.24 |
| 4-Color Rhinos | 11 | 1.14 |
| Mono-Blue Tron | 10 | 1.04 |
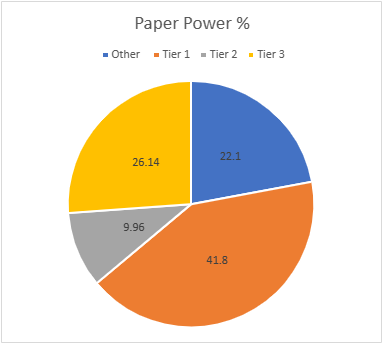
Rakdos Scam has usually underperformed relative to the other top decks in paper compared to MTGO. I'm not sure why this happens, other than it shows up at big events and is missing from small ones. I suspect, therefore, that social considerations are more at play than anything else. With fewer big events reported (many more happened than were reported), it fell considerably.
Average Power Rankings
Finally, we come to the average power rankings. These are found by taking the total points earned and dividing them by total decks, to measure points per deck. I use this to measure strength vs. popularity. Measuring deck strength is hard. There is no Wins-Above-Replacement metric for Magic, and I'm not certain that one could be credibly devised. The game is too complex, and even then, power is very contextual.
Using the power rankings certainly helps, and serves to show how justified a deck’s popularity is. However, more popular decks will still necessarily earn a lot of points. Therefore, the top tier doesn't move much between population and power, and obscures whether its decks really earned their position.
This is where the averaging comes in. Decks that earn a lot of points because they get a lot of results will do worse than decks that win more events, indicating which deck actually performs better.
A higher average indicates lots of high finishes, whereas low averages result from mediocre performances and a high population. Lower-tier decks typically do very well here, likely due to their pilots being enthusiasts. Bear this in mind, and be careful about reading too much into these results. However, as a general rule, decks which place above the baseline average are over-performing, and vice versa.
How far above or below that average a deck is can "justifiy" its position on the power tiers. Decks well above baseline are undervalued, while decks well below baseline are very popular, but aren't necessarily good.
The Real Story
When considering the average points, the key is looking at how far off a deck is from the Baseline stat (the overall average of points/population). The closer a deck’s performance to the Baseline, the more likely it is to be performing close to its “true” potential.
A deck that is exactly average would therefore perform exactly as well as expected. The greater the deviation from the average, the more a deck under or over-performs. On the low end, a deck’s placing was mainly due to population rather than power, which suggests it’s overrated. A high-scoring deck is the opposite of this.
I'll begin with the averages for MTGO:
| Deck Name | Average Points | Power Tier |
|---|---|---|
| Niv to Light | 2.50 | 3 |
| Jund Creativity | 2.00 | 3 |
| 4-Color Elementals | 1.89 | 3 |
| Living End | 1.82 | 1 |
| Mono-Green Tron | 1.80 | 2 |
| Izzet Prowess | 1.79 | 2 |
| Humans | 1.78 | 3 |
| Coffers | 1.75 | 3 |
| Temur Creativity | 1.73 | 3 |
| Amulet Titan | 1.71 | 2 |
| Mono-Blue Tron | 1.71 | 3 |
| Burn | 1.68 | 2 |
| UR Murktide | 1.63 | 1 |
| UW Control | 1.62 | 2 |
| Merfolk | 1.60 | 2 |
| Temur Rhinos | 1.59 | 1 |
| Jeskai Value Breach | 1.57 | 3 |
| Baseline | 1.54|
| |
| Rakdos Scam | 1.53 | 1 |
| Bring to Light | 1.53 | 3 |
| 4-Color Creativity | 1.52 | 1 |
| 4-Color Control | 1.44 | 3 |
| Mill | 1.43 | 3 |
| Jund Saga | 1.42 | 3 |
| Hammer Time | 1.38 | 1 |
| Jeskai Combo Breach | 1.37 | 3 |
| Belcher | 1.37 | 3 |
| 4-Color Blink | 1.36 | 3 |
| Affinity | 1.33 | 3 |
| Yawgmoth | 1.30 | 2 |
| Goryo's Kitchen | 1.30 | 3 |
| Counter Cat | 1.22 | 3 |
Well done, Living End. As the highest ranked Tier 1 deck, you're the MTGO Deck of April. Meanwhile, Hammer Time, what happened? Is Living End at fault (genuine question)?
Now the paper averages:
| Deck Name | Average Power | Power Tier |
|---|---|---|
| Temur Creativity | 3.00 | 3 |
| Living End | 2.43 | 3 |
| 4-Color Blink | 2.40 | 3 |
| Counter Cat | 2.12 | 3 |
| UR Murktide | 2.11 | 1 |
| Rakdos Scam | 2.00 | 1 |
| Grixis Shadow | 2.00 | 3 |
| 4-Color Creativity | 1.97 | 1 |
| Jeskai Combo Breach | 1.90 | 3 |
| Bring to Light | 1.90 | 3 |
| 4-Color Rhinos | 1.83 | 3 |
| Mono-Green Tron | 1.82 | 3 |
| UW Control | 1.80 | 2 |
| Hammer Time | 1.79 | 1 |
| Burn | 1.76 | 2 |
| Baseline | 1.67 | |
| 4-Color Elementals | 1.64 | 3 |
| Yawgmoth | 1.64 | 3 |
| Goryo Blink | 1.60 | 3 |
| Merfolk | 1.58 | 3 |
| Temur Rhinos | 1.57 | 1 |
| Izzet Prowess | 1.54 | 3 |
| Amulet Titan | 1.45 | 2 |
| Boros Moon | 1.33 | 3 |
| Mono-Blue Tron | 1.11 | 3 |
This is a first. UR Murktide actually managed to be the Deck of April in paper. I don't think that's ever happened in either medium before. Just goes to show how everyone underestimates the deck, even now.
Composite Metagame
That's a lot of data, but what does it all mean? When Modern Nexus was first started, we had a statistical method to combine the MTGO and paper data, but the math of that system doesn't work without big paper events. I tried. Instead, I'm using an averaging system to combine the data. I take the MTGO results and average the tier, then separately average the paper results, then average the paper and MTGO results together for final tier placement.
This generates a lot of partial Tiers. That's not a bug, but a feature. The nuance separates the solidly Tiered decks from the more flexible ones and shows the true relative power differences between the decks. Every deck in the paper and MTGO results is on the table, and when they don't appear in a given category, they're marked N/A. This is treated as a 4 for averaging purposes.
| Deck Name | MTGO Pop Tier | MTGO Power Tier | MTGO Average Tier | Paper Pop Tier | Paper Power Tier | Paper Average Tier | Composite Tier |
|---|---|---|---|---|---|---|---|
| UR Murktide | 1 | 1 | 1 | 1 | 1 | 1 | 1.00 |
| 4-Color Creativity | 1 | 1 | 1 | 1 | 1 | 1 | 1.00 |
| Temur Rhinos | 1 | 1 | 1 | 1 | 1 | 1 | 1.00 |
| Hammer Time | 1 | 1 | 1 | 1 | 1 | 1 | 1.00 |
| Rakdos Scam | 1 | 1 | 1 | 2 | 1 | 1.5 | 1.25 |
| Living End | 1 | 1 | 1 | 3 | 3 | 3 | 2.00 |
| Burn | 2 | 2 | 2 | 2 | 2 | 2 | 2.00 |
| Amulet Titan | 2 | 2 | 2 | 2 | 2 | 2 | 2.00 |
| Yawgmoth | 1 | 2 | 1.5 | 3 | 3 | 3 | 2.25 |
| UW Control | 2 | 2 | 2 | 3 | 2 | 2.5 | 2.25 |
| Merfolk | 2 | 2 | 2 | 3 | 3 | 3 | 2.50 |
| Mono-Green Tron | 3 | 2 | 2.5 | 3 | 3 | 3 | 2.75 |
| Izzet Prowess | 3 | 2 | 2.5 | 3 | 3 | 3 | 2.75 |
| Bring to Light | 3 | 3 | 3 | 3 | 3 | 3 | 3.00 |
| 4-Color Elementals | 3 | 3 | 3 | 3 | 3 | 3 | 3.00 |
| Counter Cat | 3 | 3 | 3 | 3 | 3 | 3 | 3.00 |
| Jeskai Combo Breach | 3 | 3 | 3 | 3 | 3 | 3 | 3.00 |
| Mono-Blue Tron | 3 | 3 | 3 | 3 | 3 | 3 | 3.00 |
| Jund Saga | 3 | 3 | 3 | 3 | N/A | 3.5 | 3.25 |
| 4-Color Blink | 3 | 3 | 3 | N/A | 3 | 3.5 | 3.25 |
| Temur Creativity | 3 | 3 | 3 | N/A | 3 | 3.5 | 3.25 |
| Affinity | 3 | 3 | 3 | N/A | N/A | N/A | 3.50 |
| Mill | 3 | 3 | 3 | N/A | N/A | N/A | 3.50 |
| Coffers | 3 | 3 | 3 | N/A | N/A | N/A | 3.50 |
| Goryo's Kitchen | 3 | 3 | 3 | N/A | N/A | N/A | 3.50 |
| 4-Color Control | 3 | 3 | 3 | N/A | N/A | N/A | 3.50 |
| Humans | 3 | 3 | 3 | N/A | N/A | N/A | 3.50 |
| Belcher | 3 | 3 | 3 | N/A | N/A | N/A | 3.50 |
| Jeskai Value Breach | 3 | 3 | 3 | N/A | N/A | N/A | 3.50 |
| Goryo Blink | N/A | N/A | N/A | 3 | 3 | 3 | 3.50 |
| Boros Moon | N/A | N/A | N/A | 3 | 3 | 3 | 3.50 |
| 4-Color Rhinos | N/A | N/A | N/A | 3 | 3 | 3 | 3.50 |
| Grixis Shadow | N/A | N/A | N/A | 3 | 3 | 3 | 3.50 |
| Jund Creativity | N/A | 3 | 3.5 | N/A | N/A | N/A | 3.75 |
| Niv to Light | N/A | 3 | 3.5 | N/A | N/A | N/A | 3.75 |
| Ponza | N/A | N/A | N/A | 3 | N/A | 3.5 | 3.75 |
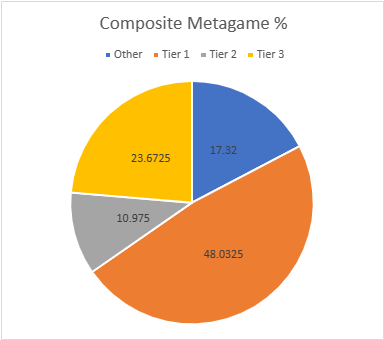
Thanks to paper's low concentration, the overall share for Tier 1 fell in April. Again, I'd advise against reading too much into that, as all the unreported events would have likely changed that finding.
An Era of Stability?
With me reporting the same top five decks for the second month in a row across all play platforms, this is feeling more like a 2015 update than anything I've done before. Strap in, readers; I don't think this will be changing anytime soon.
As always, this first-of-the-month article merely presents the collected data, offering little in the way of analysis, metagame implications, and financial opportunities. Join me on Friday when I dig into these results and discuss exactly what has my hackles up.
