
Are you a Quiet Speculation member?
If not, now is a perfect time to join up! Our powerful tools, breaking-news analysis, and exclusive Discord channel will make sure you stay up to date and ahead of the curve.
Well, that was quite a weekend. After the first Modern Pro Tour in a while, opinions are flying fast and furiously over the state of the format. Which means that it's time for me to quench and/or throw gas on the fire with the Modern Metagame Update.
The Obvious Outlier
To the surprise of no one mildly aware of Modern right now, Rakdos Scam is a statistical outlier in both paper and Magic Online (MTGO). By a very wide margin. In paper it is joined by 4-Color Control, but no other deck hit the thresholds online. It won't be very surprising upon seeing the data. As always, outliers are reported in their correct place on the metagame charts but were not included in the statistical analysis.
June Population Metagame
To make the tier list, a given deck has to beat the overall average population for the month. The average is my estimate for how many results a given deck "should" produce in a given month. Being a tiered deck requires being better than "good enough". Every deck that posts at least the average number of results is "good enough" and makes the tier list.

Then we go one standard deviation (STdev) above average to set the limit of Tier 3 and the cutoff for Tier 2. This mathematically defines Tier 3 as those decks clustered near the average. Tier 2 goes from the cutoff to the next standard deviation. These are decks that perform well above average. Tier 1 consists of those decks at least two standard deviations above the mean result, encompassing the truly exceptional performing decks.
The MTGO data nearly exclusively comes from official Preliminary and Challenge results. Leagues are excluded, as they are curated lists and thus invalid. The paper data comes from any source I can find, with all reported events being counted. While the MTGO events report predictable numbers, paper events can report anything from only the winner to all the results. In the latter case, if match results aren't included, I'll take as much of the Top 32 as possible. If match results are reported, I'll take winning record up to Top 32, and then any additional decks tied with 32nd place, as tiebreakers are a magic most foul and black.
The MTGO Population Data
In July, the adjusted average population for MTGO was 10.77, setting the Tier 3 cutoff at 11 decks. I always round down if the decimal is less than .20. Tier 3, therefore, begins with decks posting 11 results. The adjusted STdev was 18.07, so add 18 and that means Tier 3 runs to 29 results. Again, it's the starting point to the cutoff, then the next whole number for the next Tier. Therefore Tier 2 starts with 30 results and runs to 48. Subsequently, to make Tier 1, 49 decks are required.

June represents a turnaround for the data. January 2023 had 840 decks, February had 876, and March had a staggering 1,003 decks. April fell to 949 decks, May plummeted to 770 decks, and June surged to 918. July tops them all with 1086 decks. The extended All-Access Pass (intended to help with Pro Tour testing) is almost certainly behind this surge.
However, the extra population doesn't mean more diversity. January had 74 unique decks, February had 84, and March mustered 88. April, May, and June had 82 decks. July just passed June's mark with 87 decks, despite a much higher population. Of the 87 decks, only 21 made the population tier, which is up from June but down from the yearly average.
| Deck Name | Total # | Total % |
|---|---|---|
| Tier 1 | ||
| Rakdos Scam | 160 | 14.73 |
| Burn | 75 | 6.91 |
| Mono-Green Tron | 74 | 6.81 |
| 4-Color Control | 69 | 6.35 |
| Yawgmoth | 68 | 6.26 |
| Living End | 60 | 5.52 |
| UR Murktide | 54 | 4.97 |
| Tier 2 | ||
| UB Murktide | 43 | 3.96 |
| 4-Color Creativity | 38 | 3.50 |
| Temur Rhinos | 34 | 3.13 |
| Amulet Titan | 34 | 3.13 |
| Hammer Time | 33 | 3.04 |
| Tier 3 | ||
| Grixis Shadow | 29 | 2.67 |
| UW Control | 27 | 2.49 |
| Coffers | 19 | 1.75 |
| Jeskai Combo Breach | 18 | 1.66 |
| Counter Cat | 18 | 1.66 |
| Sam Combo | 13 | 1.20 |
| Wrenn White and Blue | 13 | 1.20 |
| Jund Saga | 13 | 1.20 |
| Hardened Scales | 12 | 1.10 |

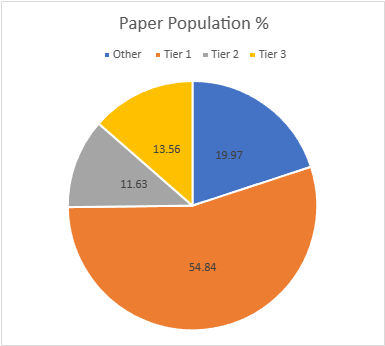
The Paper Population Data
January saw 667 decks, February is up to 807, March hit 962, April plunged to 551, May was up to 581, and June was down 547. Thanks to Pro Tour Barcelona, July is up to 671 decks. As I said, paper data is highly variable.

However, that increased population didn't equate to greater deck diversity. Quite the opposite, actually. January had 101 decks, February 108, March just 103, April down to 89, May was up to 102, and June fell to 79, a mark matched by July. Only 20 decks made the tier list, which is down just like the diversity. The adjusted average population was 6.79, so seven decks make Tier 3. The adjusted STDev was 10.34, so the increment is 11. Therefore, Tier 3 runs from 7 to 18, Tier 2 is 19 to 30, and Tier 1 is 31 and over.
| Deck Name | Total # | Total % |
|---|---|---|
| Tier 1 | ||
| Rakdos Scam | 92 | 13.71 |
| 4-Color Control | 56 | 8.35 |
| Living End | 43 | 6.41 |
| Mono-Green Tron | 40 | 5.96 |
| Hammer Time | 37 | 5.51 |
| Yawgmoth | 37 | 5.51 |
| Burn | 32 | 4.77 |
| UR Murktide | 31 | 4.62 |
| Tier 2 | ||
| 4-Color Creativity | 28 | 4.17 |
| Temur Rhinos | 26 | 3.87 |
| Amulet Titan | 24 | 3.58 |
| Tier 3 | ||
| Grixis Shadow | 18 | 2.68 |
| Jeskai Combo Breach | 13 | 1.94 |
| Coffers | 11 | 1.64 |
| UW Control | 11 | 1.64 |
| Merfolk | 9 | 1.34 |
| UB Murktide | 8 | 1.19 |
| Rakdos Rock | 7 | 1.04 |
| Counter Cat | 7 | 1.04 |
| Hardened Scales | 7 | 1.04 |
March Power Metagame
Tracking the metagame in terms of population is standard practice. But how do results actually factor in? Better decks should also have better results. In an effort to measure this, I use a power ranking system in addition to the prevalence list. By doing so, I measure the relative strengths of each deck within the metagame so that a deck that just squeaks into Top 32 isn't valued the same as one that Top 8's. This better reflects metagame potential.

For the MTGO data, points are awarded based on the population of the event. Preliminaries award points based on record (1 for 3 wins, 2 for 4 wins, 3 for 5), and Challenges are scored 3 points for the Top 8, 2 for Top 16, and 1 for Top 32. If I can find them, non-Wizards events will be awarded points the same as Challenges or Preliminaries depending on what the event in question reports/behaves like. Super Qualifiers and similar higher-level events get an extra point and so do other events if they’re over 200 players, with a fifth point for going over 400 players.
Due to paper reporting being inconsistent and frequently full of data gaps compared to MTGO, its points work differently. I award points based on the size of the tournament rather than placement. For events with no reported starting population or up to 32 players, one point is awarded to every deck. Events with 33 players up to 128 players get two points. From 129 players up to 512 players get three. Above 512 is four points, and five points will be reserved for Modern Pro Tours.
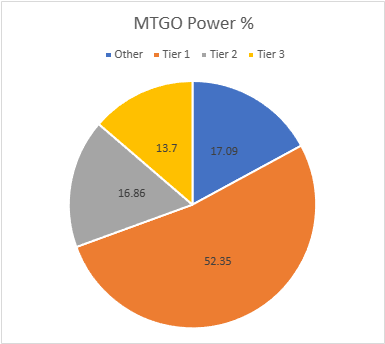
The MTGO Power Tiers
Thanks to high population, total points are massively up from 1508 to 1767. The adjusted average points were 17.39, therefore 18 points made Tier 3. The adjusted STDev was 29.63, so add 30 to the starting point, and Tier 3 runs to 48 points. Tier 2 starts with 49 points and runs to 79. Tier 1 requires at least 80 points.
Jund Saga fell off the tier list and was not replaced. The MTGO metagame is a narrow and unforgiving place.
| Deck Name | Total Points | Total % |
|---|---|---|
| Tier 1 | ||
| Rakdos Scam | 271 | 15.34 |
| 4-Color Control | 125 | 7.07 |
| Burn | 120 | 6.79 |
| Yawgmoth | 115 | 6.51 |
| Mono-Green Tron | 113 | 6.40 |
| Living End | 96 | 5.43 |
| UR Murktide | 85 | 4.81 |
| Tier 2 | ||
| UB Murktide | 70 | 3.96 |
| Temur Rhinos | 61 | 3.45 |
| 4-Color Creativity | 57 | 3.23 |
| Hammer Time | 56 | 3.17 |
| Amulet Titan | 54 | 3.06 |
| Tier 3 | ||
| Grixis Shadow | 44 | 2.49 |
| UW Control | 42 | 2.38 |
| Coffers | 30 | 1.70 |
| Jeskai Combo Breach | 30 | 1.70 |
| Counter Cat | 28 | 1.58 |
| Sam Combo | 28 | 1.58 |
| Hardened Scales | 22 | 1.25 |
| Wrenn White and Blue | 18 | 1.02 |
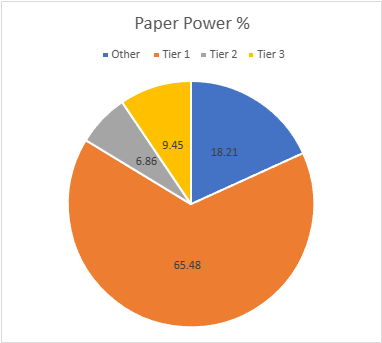
The Paper Power Tiers
The Pro Tour and a number of other four-point events shot July's points through the roof. January had 1178 points, February hit 1316, March shot to 1890, April fell to 964, May hit 1098, June reached 1208, and July hit 1428. All the points from the Pro Tour have had a strong warping effect on the data, and decks that weren't played there really suffered. The adjusted average points were 13.80, setting the cutoff at 14 points. The STDev was 23.90, thus adding 24 to the starting point and Tier 3 runs to 38 points. Tier 2 starts with 39 points and runs to 63. Tier 1 requires at least 64 points. The total decks fell to 17, as the bottom three decks didn't have the chops for the Pro Tour.
| Deck Name | Total Points | Total % |
|---|---|---|
| Tier 1 | ||
| Rakdos Scam | 248 | 17.37 |
| 4-Color Control | 117 | 8.19 |
| Mono-Green Tron | 116 | 8.12 |
| Temur Rhinos | 90 | 6.30 |
| Living End | 82 | 5.74 |
| Yawgmoth | 77 | 5.39 |
| Hammer Time | 73 | 5.11 |
| UR Murktide | 67 | 4.69 |
| Burn | 65 | 4.55 |
| Tier 2 | ||
| 4-Color Creativity | 55 | 3.85 |
| Amulet Titan | 43 | 3.01 |
| Tier 3 | ||
| Grixis Shadow | 26 | 1.82 |
| Jeskai Combo Breach | 25 | 1.75 |
| UB Murktide | 25 | 1.75 |
| UW Control | 22 | 1.54 |
| Coffers | 21 | 1.47 |
| Merfolk | 16 | 1.12 |
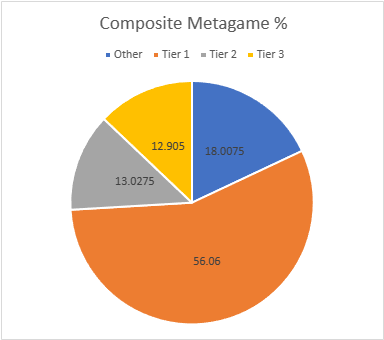
Composite Metagame
That's a lot of data, but what does it all mean? When Modern Nexus was first started, we had a statistical method to combine the MTGO and paper data, but the math of that system doesn't work without big paper events. I tried. Instead, I'm using an averaging system to combine the data. I take the MTGO results and average the tier, then separately average the paper results, then average the paper and MTGO results together for final tier placement.
This generates a lot of partial Tiers. That's not a bug, but a feature. The nuance separates the solidly Tiered decks from the more flexible ones and shows the true relative power differences between the decks. Every deck in the paper and MTGO results is on the table, and when they don't appear in a given category, they're marked N/A. This is treated as a 4 for averaging purposes.
| Deck Name | MTGO Pop Tier | MTGO Power Tier | MTGO Average Tier | Paper Pop Tier | Paper Power Tier | Paper Average Tier | Composite Tier |
|---|---|---|---|---|---|---|---|
| Rakdos Scam | 1 | 1 | 1 | 1 | 1 | 1 | 1.00 |
| Burn | 1 | 1 | 1 | 1 | 1 | 1 | 1.00 |
| Mono-Green Tron | 1 | 1 | 1 | 1 | 1 | 1 | 1.00 |
| 4-Color Control | 1 | 1 | 1 | 1 | 1 | 1 | 1.00 |
| Yawgmoth | 1 | 1 | 1 | 1 | 1 | 1 | 1.00 |
| Living End | 1 | 1 | 1 | 1 | 1 | 1 | 1.00 |
| UR Murktide | 1 | 1 | 1 | 1 | 1 | 1 | 1.00 |
| Hammer Time | 2 | 2 | 2 | 1 | 1 | 1 | 1.50 |
| Temur Rhinos | 2 | 2 | 2 | 2 | 1 | 1.5 | 1.75 |
| 4-Color Creativity | 2 | 2 | 2 | 2 | 2 | 2 | 2.00 |
| Amulet Titan | 2 | 2 | 2 | 2 | 2 | 2 | 2.00 |
| UB Murktide | 2 | 2 | 2 | 3 | 3 | 3 | 2.50 |
| Grixis Shadow | 3 | 3 | 3 | 3 | 3 | 3 | 3.00 |
| UW Control | 3 | 3 | 3 | 3 | 3 | 3 | 3.00 |
| Coffers | 3 | 3 | 3 | 3 | 3 | 3 | 3.00 |
| Jeskai Combo Breach | 3 | 3 | 3 | 3 | 3 | 3 | 3.00 |
| Counter Cat | 3 | 3 | 3 | 3 | N/A | 3.5 | 3.25 |
| Hardened Scales | 3 | 3 | 3 | 3 | N/A | 3.5 | 3.25 |
| Sam Combo | 3 | 3 | 3 | N/A | N/A | N/A | 3.50 |
| Wrenn White and Blue | 3 | 3 | 3 | N/A | N/A | N/A | 3.50 |
| Jund Saga | 3 | N/A | 3.5 | N/A | N/A | N/A | 3.50 |
| Merfolk | N/A | N/A | N/A | 3 | 3 | 3 | 3.50 |
| Rakdos Rock | N/A | N/A | N/A | 3 | N/A | 3.5 | 3.75 |
Average Power Rankings
Finally, we come to the average power rankings. These are found by taking the total points earned and dividing them by total decks, to measure points per deck. I use this to measure strength vs. popularity. Measuring deck strength is hard. There is no Wins-Above-Replacement metric for Magic, and I'm not certain that one could be credibly devised. The game is too complex, and even then, power is very contextual.
Using the power rankings certainly helps and serves to show how justified a deck’s popularity is. However, more popular decks will still necessarily earn a lot of points. Therefore, the top tier doesn't move much between population and power and obscures whether its decks really earned their position.

This is where the averaging comes in. Decks that earn a lot of points because they get a lot of results will do worse than decks that win more events, indicating which deck actually performs better.
A higher average indicates lots of high finishes, whereas low averages result from mediocre performances and a high population. Lower-tier decks typically do very well here, likely due to their pilots being enthusiasts. Bear this in mind and be careful about reading too much into these results. However, as a general rule, decks that place above the baseline average are over-performing, and vice versa.
How far above or below that average a deck sits justifies its position on the power tiers. Decks well above baseline are undervalued, while decks well below baseline are very popular, but aren't necessarily good.
The Real Story
When considering the average points, the key is looking at how far off a deck is from the Baseline stat (the overall average of points/population). The closer a deck’s performance to the Baseline, the more likely it is to be performing close to its "true" potential.
A deck that is exactly average would therefore perform exactly as well as expected. The greater the deviation from the average, the more a deck under or over-performs. On the low end, a deck’s placing was mainly due to population rather than power, which suggests it’s overrated. A high-scoring deck is the opposite of this.
I'll begin with the averages for MTGO:
| Deck Name | Average Points | Power Tier |
|---|---|---|
| Sam Combo | 2.15 | 3 |
| Hardened Scales | 1.83 | 3 |
| 4-Color Control | 1.81 | 1 |
| Temur Rhinos | 1.79 | 2 |
| Hammer Time | 1.70 | 2 |
| Rakdos Scam | 1.69 | 1 |
| Yawgmoth | 1.69 | 1 |
| Jeskai Combo Breach | 1.67 | 3 |
| UB Murktide | 1.63 | 2 |
| Burn | 1.60 | 1 |
| Living End | 1.60 | 1 |
| Amulet Titan | 1.59 | 2 |
| Coffers | 1.58 | 3 |
| UR Murktide | 1.57 | 1 |
| Baseline | 1.56 | |
| UW Control | 1.55 | 3 |
| Counter Cat | 1.55 | 3 |
| Mono-Green Tron | 1.53 | 1 |
| Grixis Shadow | 1.52 | 3 |
| 4-Color Creativity | 1.50 | 2 |
| Wrenn White and Blue | 1.38 | 3 |
Well done, 4-Color Control, you're the MTGO Deck of July. The obvious home for The One Ring was a solid choice.
Now the paper averages:
| Deck Name | Average Points | Power Tier |
|---|---|---|
| Temur Rhinos | 3.46 | 1 |
| UB Murktide | 3.12 | 3 |
| Mono-Green Tron | 2.90 | 1 |
| Rakdos Scam | 2.70 | 1 |
| UR Murktide | 2.16 | 1 |
| 4-Color Control | 2.09 | 1 |
| Yawgmoth | 2.08 | 1 |
| Burn | 2.03 | 1 |
| UW Control | 2.00 | 3 |
| Hammer Time | 1.97 | 1 |
| 4-Color Creativity | 1.96 | 2 |
| Jeskai Combo Breach | 1.92 | 3 |
| Living End | 1.91 | 1 |
| Coffers | 1.91 | 3 |
| Baseline | 1.79 | |
| Amulet Titan | 1.79 | 2 |
| Merfolk | 1.78 | 3 |
| Grixis Shadow | 1.44 | 3 |
Thanks to its massive showing at the Pro Tour (and literally no other reason) Temur Rhinos is the paper Deck of July. Apparently, Kai Budde's touch really is magic.
Analysis
While it might be tempting to dismiss Rakdos Scam as a metagame choice given how the Pro Tour played out, the fact that MTGO didn't have a Pro Tour and largely corroborated paper's results strongly indicates that there's something real to this warp. Given time, it might prove to be akin to UR Murktide's long run, but I don't think that Scam will have the opportunity.

Remember, next Monday (August 7th, 2023) is Wizards' Ban Day. If there's any concern over any card, they'll either have to ban it then or wait an entire year. Players are complaining rather loudly about Scam in general and The One Ring specifically, and given the weird concentrations, warps, and general disquiet over the past year, I have to believe that Wizards is going to do something to Modern on Monday.
I have no idea what that something is, as I don't understand how Wizards thinks. If there's a sweeping, shakeup-style ban coming, then no deck except for Burn is safe. If Wizards is looking at something more targeted, then Ring players need to worry. In the event that Wizards does want to nerf Scam, Orcish Bowmasters is an unlikely target. Aang, Swift Savior // Aang and La, Ocean's Fury or Ragavan, Nimbler Pilferer are more likely.
Market Movements
There have been movements in the card market in anticipation of Ban Day, though they've been primarily Standard cards that players are dumping before expected bans. The Modern market seems to be holding its breath, though the usual speculation is running rampant.

I would advise against taking any action before the formal announcement. The cost of selling or buying the wrong card is likely to be quite high. The hours following the announcement, if history is any indication, will be a time of market flux and an opportunity to find deals. Following that, the card market will settle down and players can plan to play their cards for at least another year. Plan accordingly.

What happened to Quiet Speculation? It went off the grid all of a sudden. I do think that the analysis here had become too overly critical of WotC. Magic: The Gathering has been through many low periods throughout its history, and every time it happens people suddenly start talking about the end of Magic. And every time it happens they always manage to come back. Lord of the Rings was an incredible way to come back. Only a few months after its release and many people would agree its one of the best Magic sets ever. The game right now is as good as it has ever been.