Are you a Quiet Speculation member?
If not, now is a perfect time to join up! Our powerful tools, breaking-news analysis, and exclusive Discord channel will make sure you stay up to date and ahead of the curve.
September marks the start of the first Modern qualifier season in a long time. In the Denver area, Modern RCQs are selling to store capacity and highly competitive, and it looks like we're not an exception. As such, there's a lot more data to pour through than normal. Not that it dramatically changed the outcome. Yes, that is extremely unsubtle foreshadowing.
Painfully Obvious
That Rakdos Scam was a statistical outlier was so painfully obvious that I didn't need to do any tests. It will make sense when you see the data. I did the tests anyway, to make sure that there weren't others. Not that I was actually expecting any others given the data. Having done this kind of thing for a long time, my intuition on outliers is pretty solid, but you can't ever skip on due diligence. Surprises happen.
As always, outliers are reported in their correct place on the metagame charts but were not included in the statistical analysis.
September Population Metagame
To make the tier list, a given deck has to beat the overall average population for the month. The average is my estimate for how many results a given deck "should" produce in a given month. Being a tiered deck requires being better than "good enough". Every deck that posts at least the average number of results is "good enough" and makes the tier list.
Then we go one standard deviation (STdev) above average to set the limit of Tier 3 and the cutoff for Tier 2. This mathematically defines Tier 3 as those decks clustered near the average. Tier 2 goes from the cutoff to the next standard deviation. These are decks that perform well above average. Tier 1 consists of those decks at least two standard deviations above the mean result, encompassing the truly exceptional performing decks.
The MTGO data nearly exclusively comes from official Preliminary and Challenge results. Leagues are excluded, as they are curated lists and thus invalid. The paper data comes from any source I can find, with all reported events being counted.
While the MTGO events report predictable numbers, paper events can report anything from only the winner to all the results. In the latter case, if match results aren't included, I'll take as much of the Top 32 as possible. If match results are reported, I'll take winning record up to Top 32, and then any additional decks tied with 32nd place, as tiebreakers are a magic most foul and black.
The MTGO Population Data
September's adjusted average population for MTGO was 9.24, setting the Tier 3 cutoff at 10 decks. I always round down if the decimal is less than .20. Tier 3, therefore, begins with decks posting 10 results. The adjusted STdev was 13.73, so add 14 and that means Tier 3 runs to 24 results. Again, it's the starting point to the cutoff, then the next whole number for the next Tier. Therefore Tier 2 starts with 25 results and runs to 39. Subsequently, to make Tier 1, 40 decks are required.
September was a good month for data. January 2023 had 840 decks, February had 876, and March had a staggering 1,003 decks. April fell to 949 decks, May plummeted to 770 decks, and June surged to 918, while July topped out at 1086, while August fell to 724 decks. September made it back to 837 decks, Daybreak having added more events and changed prizes to attract more players.
The larger population didn't translate to more diversity, however. January had 74 unique decks, February had 84, and March mustered 88. April, May, June had 82 decks, July had 87 decks, while August had just 71. September is up to 75, which is bad given how high the population is. Worse, only 20 decks made population tier, less than in August. It actually makes sense given the data.
| Deck Name | Total # | Total % |
|---|---|---|
| Tier 1 | ||
| Rakdos Scam | 153 | 18.28 |
| 4-Color Control | 54 | 6.45 |
| Yawgmoth | 52 | 6.21 |
| UR Murktide | 48 | 5.73 |
| Living End | 44 | 5.26 |
| Tier 2 | ||
| Bring to Light | 38 | 4.54 |
| Hardened Scales | 38 | 4.54 |
| Hammer Time | 33 | 3.94 |
| Temur Rhinos | 33 | 3.94 |
| Amulet Titan | 31 | 3.70 |
| Coffers | 30 | 3.58 |
| Burn | 27 | 3.22 |
| Tier 3 | ||
| 4-Color Rhinos | 23 | 2.75 |
| Mono-Green Tron | 19 | 2.27 |
| Wishshift | 17 | 2.03 |
| 4-Color Creativity | 16 | 1.91 |
| Counter Cat | 14 | 1.67 |
| UB Murktide | 12 | 1.43 |
| Heliod Company | 11 | 1.31 |
| UW Bean Control | 10 | 1.19 |

I'm not really sure what to say. Scam being 18% of the online metagame, almost three times as much as its next nearest competitor is absurd. UR Murktide had its moments, but it never stood alone to such a degree. At minimum, Hammer Time was within range. This is a severe beating.
The Paper Population Data
Meanwhile in paper the population is up considerably. January saw 667 decks, February up to 807, March hit 962, April plunged to 551, May was up to 581, June was down 547, July surged to 671 decks, and August fell to 558. Thanks to the RCQ season, paper is up to 775 decks. There were fewer big events this month, but that was more than made up for by all the RCQs. Which was actually quite annoying for me, as most of them only reported their Top 8, and frequently much less. A lot of extra work for little gain.
As with online, more decks meant more diversity, but not much more. January had 101 decks, February 108, March just 103, April down to 89, May was up to 102, June and July sat at 79, August made 77, and September is at 82. 19 decks made the tier list, the same as in August. It makes sense given the spread, but it's not a good look in any case. The adjusted average population was exactly 8, oddly enough. The adjusted STDev was 13.08, so the increment is 13. Therefore, Tier 3 runs from 8 to 21, Tier 2 is 22 to 35, and Tier 1 is 36 and over.
| Deck Name | Total # | Total % |
|---|---|---|
| Tier 1 | ||
| Rakdos Scam | 127 | 16.39 |
| UR Murktide | 50 | 6.45 |
| 4-Color Control | 49 | 6.32 |
| Temur Rhinos | 47 | 6.07 |
| Amulet Titan | 46 | 5.94 |
| Yawgmoth | 44 | 5.68 |
| Hammer Time | 41 | 5.29 |
| Tier 2 | ||
| Burn | 35 | 4.52 |
| Mono-Green Tron | 31 | 4.00 |
| Living End | 31 | 4.00 |
| Jund Saga | 24 | 3.10 |
| UB Murktide | 22 | 2.84 |
| Tier 3 | ||
| Bring to Light | 17 | 2.19 |
| Coffers | 16 | 2.06 |
| Counter Cat | 16 | 2.06 |
| Hardened Scales | 14 | 1.81 |
| 4-Color Creativity | 13 | 1.68 |
| Merfolk | 11 | 1.42 |
| 4-Color Rhinos | 8 | 1.03 |
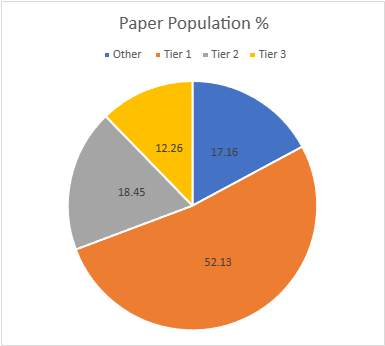
While Scam's domination of paper isn't quite as bad as it was online, it's very far removed from being good. Interestingly, paper isn't seeing the surge of Hardened Scales that MTGO did. I suspect that online's surge is a direct result of the consistently Scam dominated Challenges where paper is far more variable.
September Power Metagame
Tracking the metagame in terms of population is standard practice. But how do results actually factor in? Better decks should also have better results. In an effort to measure this, I use a power ranking system in addition to the prevalence list. By doing so, I measure the relative strengths of each deck within the metagame so that a deck that just squeaks into Top 32 isn't valued the same as one that Top 8's. This better reflects metagame potential.
For the MTGO data, points are awarded based on the population of the event. Preliminaries award points based on record (1 for 3 wins, 2 for 4 wins, 3 for 5), and Challenges are scored 3 points for the Top 8, 2 for Top 16, and 1 for Top 32. If I can find them, non-Wizards events will be awarded points the same as Challenges or Preliminaries depending on what the event in question reports/behaves like. Super Qualifiers and similar higher-level events get an extra point and so do other events if they’re over 200 players, with a fifth point for going over 400 players.
Due to paper reporting being inconsistent and frequently full of data gaps compared to MTGO, its points work differently. I award points based on the size of the tournament rather than placement. For events with no reported starting population or up to 32 players, one point is awarded to every deck. Events with 33 players up to 128 players get two points. From 129 players up to 512 players get three. Above 512 is four points, and five points will be reserved for Modern Pro Tours.
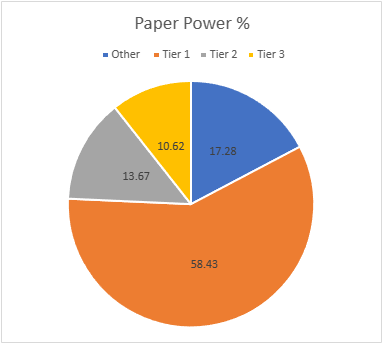
The MTGO Power Tiers
The higher population did yield more total points, though not as many more as I thought. Total points rose from 1116 to 1404 in September. The adjusted average points were 15.27, therefore 16 points made Tier 3. The adjusted STDev was 23.42, so add 24 to the starting point, and Tier 3 runs to 40 points. Tier 2 starts with 41 points and runs to 65. Tier 1 requires at least 66 points.
4-Color Rhinos just managed to jump up a tier. Meanwhile, UW Bean Control fell from the power tier, replaced by Twiddle Breach Combo and Jeskai Combo Breach.
| Deck Name | Total Points | Total % |
|---|---|---|
| Tier 1 | ||
| Rakdos Scam | 274 | 19.52 |
| 4-Color Control | 98 | 6.98 |
| Yawgmoth | 91 | 6.48 |
| UR Murktide | 76 | 5.41 |
| Living End | 72 | 5.12 |
| Tier 2 | ||
| Hardened Scales | 64 | 4.56 |
| Amulet Titan | 59 | 4.20 |
| Coffers | 58 | 4.13 |
| Bring to Light | 57 | 4.06 |
| Hammer Time | 52 | 3.70 |
| Temur Rhinos | 45 | 3.20 |
| Burn | 45 | 3.20 |
| 4-Color Rhinos | 42 | 2.99 |
| Tier 3 | ||
| Wishshift | 32 | 2.28 |
| Mono-Green Tron | 31 | 2.21 |
| Counter Cat | 26 | 1.85 |
| 4-Color Creativity | 23 | 1.64 |
| UB Murktide | 20 | 1.42 |
| Twiddle Breach Combo | 18 | 1.28 |
| Heliod Company | 17 | 1.21 |
| Jeskai Combo Breach | 17 | 1.21 |
If 18% of the population is bad, almost 20% of the points is worse. I'm slightly encouraged by the size of Tier 2, but this being the third month of Scam being such an outlier isn't instilling confidence.
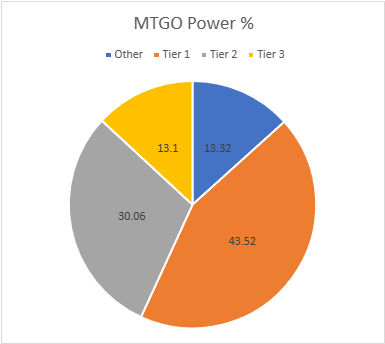
The Paper Power Tiers
As with MTGO, paper's points are up, and this time it's considerably higher. August only managed 931 points but September sees 1412, more than MTGO for the first time ever. The decently sized RCQs earning 2 points are the cause. The adjusted average points were 14.36, setting the cutoff at 15 points. The STDev was 23.96, thus adding 24 to the starting point and Tier 3 runs to 39 points. Tier 2 starts with 40 points and runs to 64. Tier 1 requires at least 65 points. 4-Color Rhinos fell off and wasn't replaced by anything.
| Deck Name | Total Points | Total % |
|---|---|---|
| Tier 1 | ||
| Rakdos Scam | 249 | 17.63 |
| 4-Color Control | 91 | 6.44 |
| Amulet Titan | 89 | 6.30 |
| UR Murktide | 85 | 6.02 |
| Hammer Time | 84 | 5.95 |
| Temur Rhinos | 79 | 5.59 |
| Yawgmoth | 79 | 5.59 |
| Burn | 69 | 4.89 |
| Tier 2 | ||
| Mono-Green Tron | 55 | 3.90 |
| Living End | 53 | 3.75 |
| Jund Saga | 45 | 3.19 |
| UB Murktide | 40 | 2.83 |
| Tier 3 | ||
| Counter Cat | 29 | 2.05 |
| Bring to Light | 26 | 1.84 |
| Coffers | 26 | 1.84 |
| Hardened Scales | 25 | 1.77 |
| 4-Color Creativity | 24 | 1.70 |
| Merfolk | 20 | 1.42 |
Between Scam's higher percentage and Burn jumping up a tier, Tier 1 accounted for almost 60% of the total results. That's never happened before, and paper is normally the more equitable play medium.
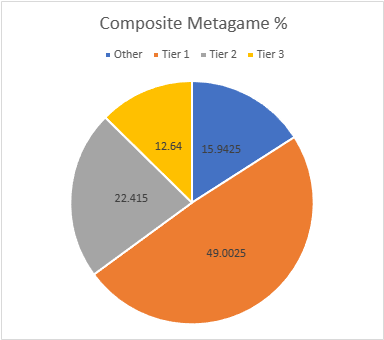
Composite Metagame
That's a lot of data, but what does it all mean? When Modern Nexus was first started, we had a statistical method to combine the MTGO and paper data, but the math of that system doesn't work without big paper events. I tried. Instead, I'm using an averaging system to combine the data. I take the MTGO results and average the tier, then separately average the paper results, then average the paper and MTGO results together for final tier placement.
This generates a lot of partial Tiers. That's not a bug, but a feature. The nuance separates the solidly Tiered decks from the more flexible ones and shows the true relative power differences between the decks. Every deck in the paper and MTGO results is on the table, and when they don't appear in a given category, they're marked N/A. This is treated as a 4 for averaging purposes.
| Deck Name | MTGO Pop Tier | MTGO Power Tier | MTGO Average Tier | Paper Pop Tier | Paper Power Tier | Paper Average Tier | Composite Tier |
|---|---|---|---|---|---|---|---|
| Rakdos Scam | 1 | 1 | 1 | 1 | 1 | 1 | 1.00 |
| 4-Color Control | 1 | 1 | 1 | 1 | 1 | 1 | 1.00 |
| Yawgmoth | 1 | 1 | 1 | 1 | 1 | 1 | 1.00 |
| UR Murktide | 1 | 1 | 1 | 1 | 1 | 1 | 1.00 |
| Living End | 1 | 1 | 1 | 2 | 2 | 2 | 1.50 |
| Hammer Time | 2 | 2 | 2 | 1 | 1 | 1 | 1.50 |
| Temur Rhinos | 2 | 2 | 2 | 1 | 1 | 1 | 1.50 |
| Amulet Titan | 2 | 2 | 2 | 1 | 1 | 1 | 1.50 |
| Burn | 2 | 2 | 2 | 2 | 1 | 1.5 | 1.75 |
| Bring to Light | 2 | 2 | 2 | 3 | 3 | 3 | 2.50 |
| Hardened Scales | 2 | 2 | 2 | 3 | 3 | 3 | 2.50 |
| Coffers | 2 | 2 | 2 | 3 | 3 | 3 | 2.50 |
| Mono-Green Tron | 3 | 3 | 3 | 2 | 2 | 2 | 2.50 |
| UB Murktide | 3 | 3 | 3 | 2 | 2 | 2 | 2.50 |
| 4-Color Rhinos | 3 | 2 | 2.5 | 3 | N/A | 3.5 | 3.00 |
| 4-Color Creativity | 3 | 3 | 3 | 3 | 3 | 3 | 3.00 |
| Counter Cat | 3 | 3 | 3 | 3 | 3 | 3 | 3.00 |
| Jund Saga | N/A | N/A | N/A | 2 | 2 | 2 | 3.00 |
| Wishshift | 3 | 3 | 3 | N/A | N/A | N/A | 3.50 |
| Heliod Company | 3 | 3 | 3 | N/A | N/A | N/A | 3.50 |
| Merfolk | N/A | N/A | N/A | 3 | 3 | 3 | 3.50 |
| UW Bean Control | 3 | N/A | 3.5 | N/A | N/A | N/A | 3.75 |
| Twiddle Breach Combo | N/A | 3 | 3.5 | N/A | N/A | N/A | 3.75 |
| Jeskai Combo Breach | N/A | 3 | 3.5 | N/A | N/A | N/A | 3.75 |
Average Power Rankings
Finally, we come to the average power rankings. These are found by taking the total points earned and dividing them by total decks, to measure points per deck. I use this to measure strength vs. popularity. Measuring deck strength is hard. There is no Wins-Above-Replacement metric for Magic, and I'm not certain that one could be credibly devised. The game is too complex, and even then, power is very contextual.
Using the power rankings certainly helps and serves to show how justified a deck’s popularity is. However, more popular decks will still necessarily earn a lot of points. Therefore, the top tier doesn't move much between population and power and obscures whether its decks really earned their position.
This is where the averaging comes in. Decks that earn a lot of points because they get a lot of results will do worse than decks that win more events, indicating which deck actually performs better.
A higher average indicates lots of high finishes, whereas low averages result from mediocre performances and a high population. Lower-tier decks typically do very well here, likely due to their pilots being enthusiasts. Bear this in mind and be careful about reading too much into these results. However, as a general rule, decks that place above the baseline average are over-performing, and vice versa.
How far above or below that average a deck sits justifies its position on the power tiers. Decks well above baseline are undervalued, while decks well below baseline are very popular, but aren't necessarily good.
The Real Story
When considering the average points, the key is looking at how far off a deck is from the Baseline stat (the overall average of points/population). The closer a deck’s performance to the Baseline, the more likely it is to be performing close to its "true" potential.
A deck that is exactly average would therefore perform exactly as well as expected. The greater the deviation from the average, the more a deck under or over-performs. On the low end, a deck’s placing was mainly due to population rather than power, which suggests it’s overrated. A high-scoring deck is the opposite of this.
I'll begin with the averages for MTGO:
| Deck Name | Average Points | Power Tier |
|---|---|---|
| Jeskai Combo Breach | 2.43 | 3 |
| Twiddle Breach Combo | 2.00 | 3 |
| Coffers | 1.93 | 2 |
| Amulet Titan | 1.90 | 2 |
| Wishshift | 1.88 | 3 |
| Counter Cat | 1.86 | 3 |
| 4-Color Rhinos | 1.83 | 2 |
| 4-Color Control | 1.81 | 1 |
| Rakdos Scam | 1.79 | 1 |
| Yawgmoth | 1.75 | 1 |
| Hardened Scales | 1.68 | 2 |
| Burn | 1.67 | 2 |
| UB Murktide | 1.67 | 3 |
| Living End | 1.64 | 1 |
| Mono-Green Tron | 1.63 | 3 |
| UR Murktide | 1.58 | 1 |
| Hammer Time | 1.57 | 2 |
| Heliod Company | 1.55 | 3 |
| Baseline | 1.50 | |
| Bring to Light | 1.50 | 2 |
| 4-Color Creativity | 1.44 | 3 |
| Temur Rhinos | 1.36 | 2 |
As the highest placing Tier 1 deck, 4-Color Control is officially the MTGO Deck of September. I hope its players actually know how to win within time limits.
Now the paper averages:
| Deck Name | Total Points | Power Tier |
|---|---|---|
| Hammer Time | 2.05 | 1 |
| Burn | 1.97 | 1 |
| Rakdos Scam | 1.96 | 1 |
| Amulet Titan | 1.93 | 1 |
| Jund Saga | 1.88 | 2 |
| 4-Color Control | 1.86 | 1 |
| 4-Color Creativity | 1.85 | 3 |
| UB Murktide | 1.82 | 2 |
| Merfolk | 1.82 | 3 |
| Counter Cat | 1.81 | 3 |
| Yawgmoth | 1.80 | 1 |
| Hardened Scales | 1.79 | 3 |
| Mono-Green Tron | 1.77 | 2 |
| Baseline | 1.75 | |
| Living End | 1.71 | 2 |
| UR Murktide | 1.70 | 1 |
| Temur Rhinos | 1.68 | 1 |
| Coffers | 1.63 | 3 |
| Bring to Light | 1.53 | 3 |
In a surprise, Hammer Time takes the crown for paper. I'll need to start packing Deflecting Palm again.
Analysis
No matter how it's sliced, the metagame pie is horribly distributed towards Rakdos Scam. The number of The One Ring decks at the top of the standings is notable, but it's incredibly small potatoes compared to what Scam is doing. The metagame is pretty clearly Scam's plaything in a way that it really wasn't for Murktide. It's outperforming everything else at every stage of the game.
The question for me is why this didn't happen sooner. Scam has always had "oops, I win" appeal, similar to Hammer Time. However, its namesake combo was never as consistent has Hammer's, and so it didn't take off until relatively recently. It had a very strong grind plan thanks to Seasoned Pyromancer and/or Fable of the Mirror-Breaker // Reflection of Kiki-Jiki. The addition of Orcish Bowmasters saw the deck skyrocket, but I don't think that's the whole story.
Bridging the Gap
Prior to Bowmasters Scam was a deck, but it was quite inconsistent. I'd be high Tier 1 one-month, mid-Tier 2 the next, then back to low Tier 1 ad nauseam. The deck had two solid plans, but they weren't connected by anything. The Scam plan all cost one mana or less, the grind plan was all three mana or more. There was no bridge connecting the two plans besides Dauthi Voidwalker, and the deck was strongly boom or bust. Bowmasters extended the grind plan down the curve and smoothed the deck.
However, even with that, it's likely that Scam would have remained just a player rather than dominating force except for the wider metagame context. Bowmasters is one of the few ways to punish The One Ring and Up the Beanstalk in Modern, and the only one that players are willing to widely play. The proliferation of card draw has pushed Scam as the answer to the 4-Color grindy decks, and so long as that remains the case, this metagame warp is likely to continue.
Market Movements
Wizards said in the August Ban Announcement that they knew that Bowmasters and Ring were problem cards. They just didn't want to take action one month after they released, almost certainly because they'd already ordered several more print runs of Tales of Middle Earth. They also said that they'd be more amenable to making changes to non-Standard formats in their post-release windows, with the next one being October 16.
I can't imagine Wizards not taking action in Modern on the 16th. Then again, I've been saying that the absurd outliers I've catalogued for the past two years need addressing and Wizards has proved stubbornly aloof. The only thing that will substantially shake the markets in October will be a ban announcement.
In the event of a ban, Rakdos Scam and Ring decks will be the most likely targets. Bowmasters itself is likely safe, but The One Ring definitely isn't. I'd peg Ring, Ragavan, Nimble Pilferer, and Fury as the most likely targets. Winners of a likely ban are one-toughness creatures, Urza's Saga, and Indomitable Creativity. Plan accordingly.

Rakdos is a very unusual color pie to be dominating the metagame. WotC might be content in letting it play out as long as it can. Ragavan, Nimble Pilferer and Orcish Bowmasters are simply too popular to ban outright. It’s a midrange deck that players seem to genuinely enjoy.