Are you a Quiet Speculation member?
If not, now is a perfect time to join up! Our powerful tools, breaking-news analysis, and exclusive Discord channel will make sure you stay up to date and ahead of the curve.
It's finally over. Wizards has finally taken action to address the problems I've been identifying in this column since June. Now we all have to wait and see how it shakes out. It also renders the metagame data moot, as that metagame is now dead. However, I was 99% done with it when the ban was announced, so I'm not going to just throw away all that work. Let this therefore stand as a historical record for why the bans were necessary.
Maybe They'll be Gone Next Time
For what is hopefully (probably isn't) the final month, the data has an outlier. It is exactly the outlier everyone is expecting, Rakdos Scam. By the worst margins yet. Interestingly, Yawgmoth was right on the outlier line in Magic Online's data. A few tests had it as an outlier by a miniscule amount, and most said it was fine. I left in for the analysis as doing so didn't substantively change anything.
As always, outliers are reported in their proper place on the metagame standings but are removed from the statistical analysis.
October Population Metagame
To make the tier list, a given deck has to beat the overall average population for the month. The average is my estimate for how many results a given deck "should" produce in a given month. Being a tiered deck requires being better than "good enough". Every deck that posts at least the average number of results is "good enough" and makes the tier list.
Then we go one standard deviation (STdev) above average to set the limit of Tier 3 and the cutoff for Tier 2. This mathematically defines Tier 3 as those decks clustered near the average. Tier 2 goes from the cutoff to the next standard deviation. These are decks that perform well above average. Tier 1 consists of those decks at least two standard deviations above the mean result, encompassing the truly exceptional performing decks.
The MTGO data nearly exclusively comes from official Preliminary and Challenge results. Leagues are excluded, as they are curated lists and thus invalid. The paper data comes from any source I can find, with all reported events being counted.
While the MTGO events report predictable numbers, paper events can report anything from only the winner to all the results. In the latter case, if match results aren't included, I'll take as much of the Top 32 as possible. If match results are reported, I'll take winning record up to Top 32, and then any additional decks tied with 32nd place, as tiebreakers are a magic most foul and black.
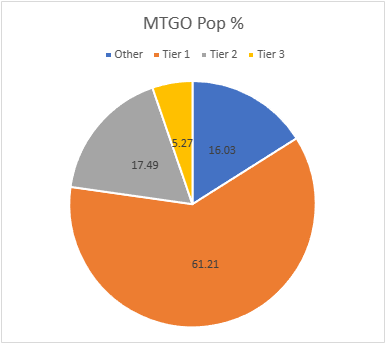
The MTGO Population Data
October's adjusted average population for MTGO was 9.55, setting the Tier 3 cutoff at 10 decks. I always round down if the decimal is less than .20. Tier 3, therefore, begins with decks posting 10 results. The adjusted STdev was 15.87, so add 16 and that means Tier 3 runs to 26 results. Again, it's the starting point to the cutoff, then the next whole number for the next Tier. Therefore Tier 2 starts with 27 results and runs to 43. Subsequently, to make Tier 1, 44 decks are required.
The population is down in November, despite the Last Chance Qualifiers. January 2023 had 840 decks, February had 876, and March had a staggering 1,003 decks. April fell to 949 decks, May plummeted to 770 decks, and June surged to 918, while July topped out at 1086, August fell to 724 decks, and September hit 837 decks, and October hit 935. November only hit 892, good for the year, but it reverses the trend.
Diversity crashed in November, out of proportion to the population dropoff. January had 74 unique decks, February had 84, and March mustered 88. April, May, June had 82 decks, July had 87 decks, August crashed to 71, and September was up to 75, October made 78. I'm not surprised given the table directly below this sentence.
| Deck Name | Total # | Total % |
|---|---|---|
| Tier 1 | ||
| Rakdos Scam | 252 | 28.25 |
| Yawgmoth | 65 | 7.29 |
| Living End | 62 | 6.95 |
| 4-Color Bean Cascade | 60 | 6.73 |
| Temur Rhinos | 58 | 6.50 |
| Amulet Titan | 49 | 5.49 |
| Tier 2 | ||
| Hardened Scales | 31 | 3.48 |
| Coffers | 30 | 3.36 |
| Tier 3 | ||
| UR Murktide | 26 | 2.91 |
| Mono-Green Tron | 25 | 2.80 |
| Burn | 22 | 2.47 |
| Hammer Time | 22 | 2.47 |
| 4-Color Rhinos | 14 | 1.57 |
| 4-Color Control | 12 | 1.35 |
| Jund Saga | 11 | 1.23 |
| Belcher | 10 | 1.12 |
For the record, Scam was sitting at 30% or higher for most of November. It was only in the final week that it disappeared from the Preliminaries and let other decks have some space. I'm not excusing the deck or what happened, but it's worth noting.
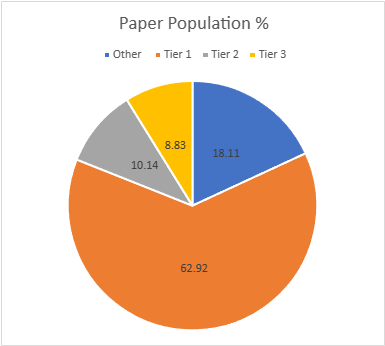
The Paper Population Data
Paper's population also fell thanks to RCQ season winding down. January saw 667 decks, February up to 807, March hit 962, April plunged to 551, May was up to 581, June was down 547, July surged to 671 decks, and August fell to 558, September hit 775 decks, while October surged to a record 1,102 decks. November couldn't match that mark at 917 decks.
Like MTGO, paper's diversity fell considerably. January had 101 decks, February 108, March just 103, April down to 89, May was up to 102, June and July sat at 79, August made 77, and September hit 82, and October had a record 109. November is just 87, average for the year. Tiered decks consequently fell from 22 to 18. The adjusted average population was 8.65, so 9 results make the list. The adjusted STDev was 15.04, so the increment is 15. Therefore, Tier 3 runs from 9 to 24, Tier 2 is 25 to 40, and Tier 1 is 41 and over.
| Deck Name | Total # | Total % |
|---|---|---|
| Tier 1 | ||
| Rakdos Scam | 173 | 18.87 |
| Temur Rhinos | 67 | 7.31 |
| Yawgmoth | 57 | 6.22 |
| Amulet Titan | 52 | 5.67 |
| 4-Color Bean Cascade | 49 | 5.34 |
| Hammer Time | 49 | 5.34 |
| Living End | 45 | 4.91 |
| Burn | 43 | 4.69 |
| Hardened Scales | 42 | 4.58 |
| Tier 2 | ||
| Mono-Green Tron | 35 | 3.82 |
| Coffers | 34 | 3.71 |
| UR Murktide | 24 | 2.62 |
| Tier 3 | ||
| 4-Color Control | 19 | 2.07 |
| Merfolk | 17 | 1.85 |
| Counter Cat | 14 | 1.53 |
| Jund Saga | 13 | 1.42 |
| Heliod Company | 9 | 0.98 |
| Temur Murktide | 9 | 0.98 |
October Power Metagame
Tracking the metagame in terms of population is standard practice. But how do results actually factor in? Better decks should also have better results. In an effort to measure this, I use a power ranking system in addition to the prevalence list. By doing so, I measure the relative strengths of each deck within the metagame so that a deck that just squeaks into Top 32 isn't valued the same as one that Top 8's. This better reflects metagame potential.
For the MTGO data, points are awarded based on the population of the event. Preliminaries award points based on record (1 for 3 wins, 2 for 4 wins, 3 for 5), and Challenges are scored 3 points for the Top 8, 2 for Top 16, and 1 for Top 32. If I can find them, non-Wizards events will be awarded points the same as Challenges or Preliminaries depending on what the event in question reports/behaves like. Super Qualifiers and similar higher-level events get an extra point and so do other events if they’re over 200 players, with a fifth point for going over 400 players.
Due to paper reporting being inconsistent and frequently full of data gaps compared to MTGO, its points work differently. I award points based on the size of the tournament rather than placement. For events with no reported starting population or up to 32 players, one point is awarded to every deck. Events with 33 players up to 128 players get two points. From 129 players up to 512 players get three. Above 512 is four points, and five points will be reserved for Modern Pro Tours.
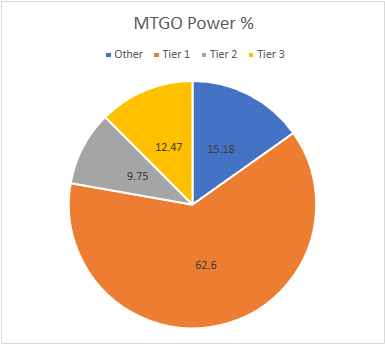
The MTGO Power Tiers
As with population, total points are down slightly, from 1490 in October to 1436 in November. The adjusted average points were 15.19, therefore 15 points made Tier 3. The adjusted STDev was 25.89, so add 26 to the starting point, and Tier 3 runs to 41 points. Tier 2 starts with 42 points and runs to 68. Tier 1 requires at least 69 points.
There was some movement between tiers but no deck fell off or made it from population to power.
| Deck Name | Total Points | Total % |
|---|---|---|
| Tier 1 | ||
| Rakdos Scam | 418 | 29.11 |
| Yawgmoth | 108 | 7.52 |
| Living End | 98 | 6.82 |
| 4-Color Bean Cascade | 98 | 6.82 |
| Amulet Titan | 89 | 6.20 |
| Temur Rhinos | 88 | 6.13 |
| Tier 2 | ||
| Hardened Scales | 50 | 3.48 |
| Coffers | 48 | 3.34 |
| Mono-Green Tron | 42 | 2.92 |
| Tier 3 | ||
| Burn | 39 | 2.72 |
| UR Murktide | 35 | 2.44 |
| Hammer Time | 32 | 2.23 |
| 4-Color Rhinos | 21 | 1.46 |
| Jund Saga | 21 | 1.46 |
| 4-Color Control | 16 | 1.11 |
| Belcher | 15 | 1.04 |
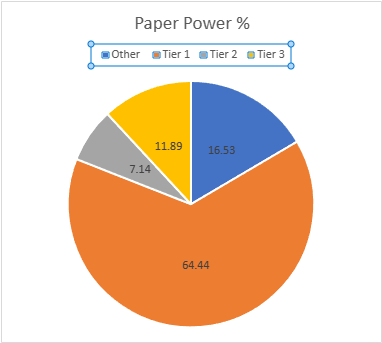
The Paper Power Tiers
As with the population, paper's points fell considerably. November failed to match October's 1829 points, only managing 1724. There were more large events, but far fewer RCQs to boost the data. The adjusted average points were 15.94, setting the cutoff at 16 points. The STDev was 28.11, thus adding 28 to the starting point and Tier 3 runs to 44 points. Tier 2 starts with 45 points and runs to 73. Tier 1 requires at least 74 points. 4-Color Rhinos managed to make the power tier after missing on population.
| Deck Name | Total # | Total % |
|---|---|---|
| Tier 1 | ||
| Rakdos Scam | 353 | 20.48 |
| Temur Rhinos | 122 | 7.08 |
| Yawgmoth | 106 | 6.15 |
| Amulet Titan | 99 | 5.74 |
| 4-Color Bean Cascade | 96 | 5.57 |
| Hammer Time | 95 | 5.51 |
| Burn | 81 | 4.70 |
| Living End | 80 | 4.64 |
| Hardened Scales | 79 | 4.58 |
| Tier 2 | ||
| Coffers | 62 | 3.60 |
| Mono-Green Tron | 61 | 3.54 |
| Tier 3 | ||
| UR Murktide | 44 | 2.55 |
| 4-Color Control | 36 | 2.09 |
| Merfolk | 27 | 1.57 |
| Jund Saga | 26 | 1.51 |
| Counter Cat | 23 | 1.33 |
| Heliod Company | 17 | 0.99 |
| Temur Murktide | 16 | 0.93 |
| 4-Color Rhinos | 16 | 0.93 |
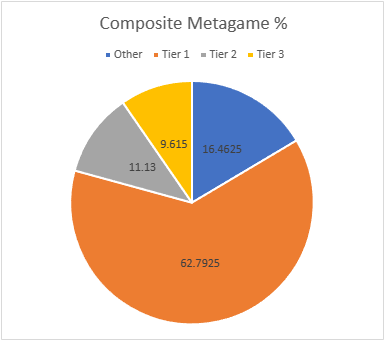
Composite Metagame
That's a lot of data, but what does it all mean? When Modern Nexus was first started, we had a statistical method to combine the MTGO and paper data, but the math of that system doesn't work without big paper events. I tried. Instead, I'm using an averaging system to combine the data. I take the MTGO results and average the tier, then separately average the paper results, then average the paper and MTGO results together for final tier placement.
This generates a lot of partial Tiers. That's not a bug, but a feature. The nuance separates the solidly Tiered decks from the more flexible ones and shows the true relative power differences between the decks. Every deck in the paper and MTGO results is on the table, and when they don't appear in a given category, they're marked N/A. This is treated as a 4 for averaging purposes.
| Deck Name | MTGO Pop Tier | MTGO Power Tier | MTGO Average Tier | Paper Pop Tier | Paper Power Tier | Paper Average Tier | Composite Tier |
|---|---|---|---|---|---|---|---|
| Rakdos Scam | 1 | 1 | 1 | 1 | 1 | 1 | 1.00 |
| Yawgmoth | 1 | 1 | 1 | 1 | 1 | 1 | 1.00 |
| Living End | 1 | 1 | 1 | 1 | 1 | 1 | 1.00 |
| 4-Color Bean Cascade | 1 | 1 | 1 | 1 | 1 | 1 | 1.00 |
| Temur Rhinos | 1 | 1 | 1 | 1 | 1 | 1 | 1.00 |
| Amulet Titan | 1 | 1 | 1 | 1 | 1 | 1 | 1.00 |
| Hardened Scales | 2 | 2 | 2 | 1 | 1 | 1 | 1.50 |
| Burn | 3 | 3 | 3 | 1 | 1 | 1 | 2.00 |
| Hammer Time | 3 | 3 | 3 | 1 | 1 | 1 | 2.00 |
| Coffers | 2 | 2 | 2 | 2 | 2 | 2 | 2.00 |
| Mono-Green Tron | 3 | 2 | 2.5 | 2 | 2 | 2 | 2.25 |
| UR Murktide | 3 | 3 | 3 | 2 | 3 | 2.5 | 2.75 |
| 4-Color Control | 3 | 3 | 3 | 3 | 3 | 3 | 3.00 |
| Jund Saga | 3 | 3 | 3 | 3 | 3 | 3 | 3.00 |
| 4-Color Rhinos | 3 | 3 | 3 | N/A | 3 | 3.5 | 3.25 |
| Belcher | 3 | 3 | 3 | N/A | N/A | N/A | 3.50 |
| Merfolk | N/A | N/A | N/A | 3 | 3 | 3 | 3.50 |
| Counter Cat | N/A | N/A | N/A | 3 | 3 | 3 | 3.50 |
| Heliod Company | N/A | N/A | N/A | 3 | 3 | 3 | 3.50 |
| Temur Murktide | N/A | N/A | N/A | 3 | 3 | 3 | 3.50 |
Average Power Rankings
Finally, we come to the average power rankings. These are found by taking the total points earned and dividing them by total decks, to measure points per deck. I use this to measure strength vs. popularity. Measuring deck strength is hard. There is no Wins-Above-Replacement metric for Magic, and I'm not certain that one could be credibly devised. The game is too complex, and even then, power is very contextual.
Using the power rankings certainly helps and serves to show how justified a deck’s popularity is. However, more popular decks will still necessarily earn a lot of points. Therefore, the top tier doesn't move much between population and power and obscures whether its decks really earned their position.
This is where the averaging comes in. Decks that earn a lot of points because they get a lot of results will do worse than decks that win more events, indicating which deck actually performs better.
A higher average indicates lots of high finishes, whereas low averages result from mediocre performances and a high population. Lower-tier decks typically do very well here, likely due to their pilots being enthusiasts. Bear this in mind and be careful about reading too much into these results. However, as a general rule, decks that place above the baseline average are over-performing, and vice versa.
How far above or below that average a deck sits justifies its position on the power tiers. Decks well above baseline are undervalued, while decks well below baseline are very popular, but aren't necessarily good.
The Real Story
When considering the average points, the key is looking at how far off a deck is from the Baseline stat (the overall average of points/population). The closer a deck’s performance to the Baseline, the more likely it is to be performing close to its "true" potential.
A deck that is exactly average would therefore perform exactly as well as expected. The greater the deviation from the average, the more a deck under or over-performs. On the low end, a deck’s placing was mainly due to population rather than power, which suggests it’s overrated. A high-scoring deck is the opposite of this.
I'll begin with the averages for MTGO:
| Deck Name | Average Points | Power Tier |
|---|---|---|
| Jund Saga | 1.91 | 3 |
| Amulet Titan | 1.82 | 1 |
| Burn | 1.77 | 3 |
| Mono-Green Tron | 1.68 | 2 |
| Rakdos Scam | 1.66 | 1 |
| Yawgmoth | 1.66 | 1 |
| 4-Color Bean Cascade | 1.63 | 1 |
| Hardened Scales | 1.61 | 2 |
| Coffers | 1.60 | 2 |
| Living End | 1.58 | 1 |
| Baseline | 1.52 | |
| Temur Rhinos | 1.52 | 1 |
| 4-Color Rhinos | 1.50 | 3 |
| Belcher | 1.50 | 3 |
| Hammer Time | 1.45 | 3 |
| UR Murktide | 1.35 | 3 |
| 4-Color Control | 1.33 | 3 |
As the highest placing Tier 1 deck, Amulet Titan is the MTGO Deck of November. Being mostly lands is apparently good against discard.
Now the paper averages:
| Deck Name | Average Power | Power Tier |
|---|---|---|
| Rakdos Scam | 2.04 | 1 |
| Jund Saga | 2.00 | 3 |
| 4-Color Rhinos | 2.00 | 3 |
| 4-Color Bean Cascade | 1.96 | 1 |
| Hammer Time | 1.94 | 1 |
| Amulet Titan | 1.90 | 1 |
| 4-Color Control | 1.89 | 3 |
| Heliod Company | 1.89 | 3 |
| Burn | 1.88 | 1 |
| Hardened Scales | 1.88 | 1 |
| Yawgmoth | 1.86 | 1 |
| UR Murktide | 1.83 | 2 |
| Temur Rhinos | 1.82 | 1 |
| Coffers | 1.82 | 2 |
| Baseline | 1.79 | |
| Living End | 1.78 | 1 |
| Temur Murktide | 1.78 | 3 |
| Mono-Green Tron | 1.74 | 2 |
| Counter Cat | 1.64 | 3 |
| Merfolk | 1.59 | 3 |
Well done, Scam. With your last dying breath, you claim the title of Paper's Deck of November. Now go away.
Financial Analysis
I'll give Wizards the credit that its due: when forced to, it can be quite transparent. Their weekly stream last week focused on the controversies surrounding their banlist policy as it pertains to older formats. In it they finally spelled out how things are going to work going forward and apologized for the debacle back in September. This should have happened a lot earlier, but progress should always be encouraged.
With Fury and Up the Beanstalk now banned, Modern is going to be in a state of flux. For at least the next week, players are going to try to make their janky brews (that they were convinced Fury suppressed) work, only to find that they're still just bad. This is a chance to move product that is otherwise unmovable, if the opportunity arises.
Wizards could not have telegraphed the Fury ban any harder during their stream without outright stating that it would be banned. Anyone taking a bath on it has only themselves to blame, and Beanstalk sees enough play elsewhere to hold on to. Grief and the other pitch elementals also saw price decreases, but that was more market panic than anything. If Grief scamming was good enough, then a Grief/Ephemerate deck would have succeeded by now. Those prices should rise again soon, and as the new metagame arises there will be more opportunities.
Metagame Implications
How the bannings will shake out long-term are impossible to say. A deck's place in any format is a function not just of its own merits and power but of the metagame it inhabits. Movements among the other decks can strongly impact a deck's playability even when it is otherwise unaffected by change. Thus, I can't know the end result, but there are certain impacts that can be seen immediately.
The Fury Ban
Fury's ban doesn't kill any deck outright, but it changes play patterns enough that it will significantly change the metagame. Fury allowed any deck to win the tempo war against creatures by being a free sweeper. There was simply no chance for a deck with Fury to ever fall too far behind on board against small creatures. Without Fury, they're far more vulnerable.
While the only deck I think Fury actively kept from playability was Humans, it did exert undeniable pressure on the metagame as a whole and certainly decreased the attractiveness of go-wide creature strategies. They will be making a return in the immediate future. Whether they're actually still viable or not is another matter. There's still plenty of spot removal available to replace Fury, though no sweepers.
Scam takes a big hit, and I'm not certain that the strategy will survive. As stated above, scamming Grief is very annoying, but it isn't actually good. What made Scam such a force was scammed Fury, and I believe that it isn't good enough anymore. Instead, Rakdos will either move more aggro or midrange value and cut the Feign Death effects. The skeleton of the deck is too good to simply die.
The Bean Ban
Losing Beanstalk is simultaneously very impactful, and no loss. Unlike Fury, banning Beanstalk kills a deck. 4-Color Bean Cascade was entirely dedicated to maximizing Beanstalk. The point of the deck is gone, so now it's pointless to continue playing the deck. No ifs, ands, or buts, it's dead. There are a number of other decks that will be hurting without that draw engine, too.
However, there's a clear path to adapt. 4-Color players will simply revert their builds back to pre-Beanstalk form and continue on. The One Ring will return to being the best draw engine in Modern, but now there's a strong answer in Tishana's Tidebinder. I doubt that 4-Color will be as dominating this time around as it was pre-Lost Cavern's of Ixalan as a result. However, The Ring's seat remains uncomfortably warm, going by Wizards' statements.
