
Are you a Quiet Speculation member?
If not, now is a perfect time to join up! Our powerful tools, breaking-news analysis, and exclusive Discord channel will make sure you stay up to date and ahead of the curve.
The first RCQs happened in April and their data is a welcome addition to the paper statistics. It's also highlighting the often-odd similarities and differences between the online and paper metagames. Their metagames looks broadly similar, but once you get into the details it's very clear that they're drawing very different conclusions about what, aside from Boros Energy, is actually good.
In fact, if you ignore what Energy's doing, the metagame looks pretty healthy.
It's very hard to ignore what Energy continues to do.
Energy's Still an Outlier
Speaking of which, Boros Energy continues to be a very substantial outlier in both paper and online play. In fact, its stats are, within margin of error, the same as March. Consistency like that is quite rare. However, unlike in March, Energy did not threaten to make Tier 0 in paper. RCQ season means lots of small events so it couldn't generate the average points necessary to pull away. Jeskai Blink was just below the outlier line online, but nothing else even came close.
As always, outliers are removed from the statistical analysis but are reported in their correct place on the Tier List.
April Population Metagame
To make the tier list, a given deck has to beat the overall average population for the month. The average is my estimate for how many results a given deck "should" produce in a given month. To be considered a tiered deck, it must perform better than "good enough". Every deck that posts at least the average number of results is "good enough" and makes the tier list.
Then we go one standard deviation (STdev) above average to set the limit of Tier 3 and the cutoff for Tier 2. This mathematically defines Tier 3 as those decks clustered near the average. Tier 2 goes from the cutoff to the next standard deviation. These are decks that perform well above average. Tier 1 consists of those decks at least two standard deviations above the mean result, encompassing the truly exceptional performing decks.
The Magic Online data nearly exclusively comes from official Preliminary, Qualifiers, and Challenge results. Leagues are excluded, as they add analytically useless bulk data to both the population and power tiers. The paper data comes from any source I can find, with all reported events being counted.
While the MTGO events report predictable numbers, paper events can report anything from only the winner to all the results. In the latter case, if match results aren't included, I'll take as much of the Top 32 as possible. If match results are reported, I'll take winning record up to Top 32, and then any additional decks tied with 32nd place, as tiebreakers are a magic most foul and black.
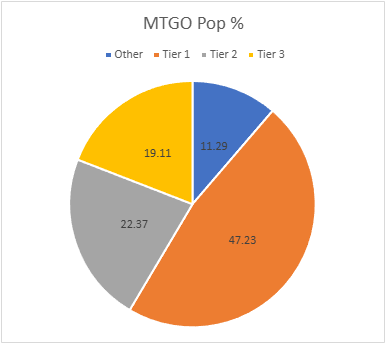
The MTGO Population Data
April's adjusted average population for MTGO is 13.06. I always round down if the decimal is less than .20. Tier 3, therefore, begins with decks posting 13 results. The adjusted STdev was 20.41, so add 21 and that means Tier 3 runs to 34 results. Again, it's the starting point to the cutoff, then the next whole number for the next Tier. Therefore Tier 2 starts with 35 results and runs to 56. Subsequently, to make Tier 1, 57 decks are required.
The sample population is substantially down from March's 1782 to 1408. No Showcases, no Last Chances, or other extra events to boost the numbers. Concurrently, unique decks fell from 110 to 86, the unique deck ratio fell slightly .0617 to .0611. That's low for MTGO, but since it's not that much lower despite the overall population being much lower, it's not that bad. The consolidation I've noticed in the online metagame is proceeding apiece and I don't see any reason it will stop on its own. 25 decks made the Tier List, breaking the two-month streak of 26.
| Deck Name | Total # | Total % |
|---|---|---|
| Tier 1 | ||
| Boros Energy | 298 | 21.16 |
| Jeskai Blink | 100 | 7.10 |
| Amulet Titan | 77 | 5.47 |
| Weapons Affinity | 71 | 5.04 |
| Ruby Storm | 61 | 4.33 |
| Kappa's Cannons | 58 | 4.12 |
| Tier 2 | ||
| Goryo Blink | 49 | 3.48 |
| Izzet Prowess | 49 | 3.48 |
| Colorless Etron | 46 | 3.27 |
| Tameshi Belcher | 45 | 3.20 |
| Neobrand | 44 | 3.12 |
| Domain Zoo | 41 | 2.91 |
| Living End | 41 | 2.91 |
| Tier 3 | ||
| Grixis Reanimator | 30 | 2.13 |
| Dimir Control | 29 | 2.06 |
| Dimir Tempo | 28 | 1.99 |
| Jeskai Control | 26 | 1.85 |
| Green-Based Eldrazi | 25 | 1.78 |
| Simic Ritual | 23 | 1.63 |
| Broodscale Combo | 23 | 1.63 |
| Esper Blink | 23 | 1.63 |
| RW Ponza | 18 | 1.28 |
| Jeskai Midrange | 17 | 1.21 |
| UW Control | 14 | 0.99 |
| Mardu Blink | 13 | 0.92 |
For the second straight month, 21% of the Modern metagame is Boros Energy. This means it averaged seven appearances in every Challenge for the entire month. That is continuing in May at time of writing.
Meanwhile, the Blink archetype's stats are deceptive. During the opening weeks, it was just barely behind Energy and trended like it might take the top slot. Then it just died. Roughly 2/3's of Jeskai Blink's results came before April 14th, and those results it managed after then were mostly Top 32 appearances rather than Top 8, crashing its average points.
Once the crash set in, Mardu Blink made a run, except it also didn't. While it managed to (just) make Tier 3, almost all of that was MTGO handle Jedgi's results. I've always said specialists can make any deck work, but this was ridiculous. There's a lot more to Blink happenings to discuss, but I'll save it for the analysis section.
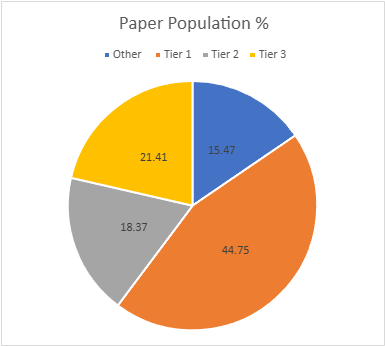
The Paper Population Data
The trend from March continued into April and set a new high mark for 2026's paper population: 724, up from 658. Of course, this continues to be only part of the actual RCQ activity. There were three in my area that didn't get reported anywhere. I'm not happy with you guys, you know who you are.
Unique decks actually fell slightly from 80 to 77 with a ratio of .106. This is not a great sign, but I did predict this would happen. Players are far less experimental when there are real stakes, and this fall happens most years. Honestly, that diversity only fell slightly is a positive thing.
23 decks made the Tier List this month, down a deck from March. The adjusted average population is 8.03 so the List starts at 8. The STDev is 11.73, so the increment is 12. Therefore, Tier 3 runs from 8 to 20, Tier 2 is 21 to 33 and Tier 1 is 34 and over.
| Deck Name | Total # | Total % |
|---|---|---|
| Tier 1 | ||
| Boros Energy | 114 | 15.75 |
| Jeskai Blink | 52 | 7.18 |
| Izzet Prowess | 42 | 5.80 |
| Domain Zoo | 40 | 5.52 |
| Amulet Titan | 39 | 5.39 |
| Weapons Affinity | 37 | 5.11 |
| Tier 2 | ||
| Goryo Blink | 32 | 4.42 |
| Green-Based Eldrazi | 28 | 3.87 |
| Kappa's Cannons | 27 | 3.73 |
| Tameshi Belcher | 25 | 3.45 |
| Esper Blink | 21 | 2.90 |
| Tier 3 | ||
| Broodscale Combo | 18 | 2.49 |
| Colorless Etron | 17 | 2.35 |
| Jeskai Control | 15 | 2.07 |
| Yawgmoth | 15 | 2.07 |
| Living End | 15 | 2.07 |
| Ruby Storm | 15 | 2.07 |
| Simic Ritual | 15 | 2.07 |
| Dimir Tempo | 13 | 1.80 |
| Neobrand | 12 | 1.66 |
| Izzet Cutter | 12 | 1.66 |
| Sam's Ritual | 8 | 1.10 |
| Mill | 8 | 1.10 |
Unlike MTGO, Energy's share actually rose marginally in paper. The old Pro Tour saw of "Just play the best deck" feels explanatory.
Meanwhile, Blink had a fine, but not particularly standout, month in paper. Unlike MTGO there wasn't a clear dropoff point or decline. It just kinda chugged along getting results at a slightly higher rate the other decks. There also wasn't a significant challenge from alternate versions. Esper's still around, but Mardu didn't do anything because there was no equivalent to Jedgi to prop it up.
I'll take this opportunity to note that the distinctions between Weapons Affinity and Kappa's Cannons have gotten sufficiently blurry that I'm not going to bother differentiating them going forward. Affinity used to be more clearly about sacrifice effects and little creatures, Kappa was all Kappa Cannoneer and Emry. Now they're overlapping and the little creatures have disappeared. I refuse to split hairs about deck classification, so they're all just Weapons Manufacturing until a new and clear dividing line emerges.
April Power Metagame
Tracking the metagame in terms of population is standard practice. But how do results actually factor in? Better decks should also have better results. In an effort to measure this, I use a power ranking system in addition to the prevalence list. By doing so, I measure the relative strengths of each deck within the metagame so that a deck that just squeaks into Top 32 isn't valued the same as one that Top 8's. This better reflects metagame potential.
For the MTGO data, points are awarded based on the population of the event. Preliminaries and similar events award points based on record (1 for 3 wins, 2 for 4 wins, 3 for 5), and Challenges are scored 3 points for the Top 8, 2 for Top 16, and 1 for Top 32. If I can find them, non-Wizards events will be awarded points the same as Challenges or Preliminaries depending on what the event in question reports/behaves like. Super Qualifiers and similar higher-level events get an extra point and so do other events if they’re over 200 players, with a fifth point for going over 400 players.
Due to paper reporting being inconsistent and frequently full of data gaps compared to MTGO, its points work differently. I award points based on the size of the tournament rather than placement. For events with no reported starting population or up to 32 players, one point is awarded to every deck. Events with 33 players up to 128 players get two points. From 129 players up to 512 players get three. Above 512 is four points, and five points is reserved for Modern Pro Tours. When paper reports more than the Top 8, which is rare, I take all the decks with a winning record or tied for Top 32, whichever is pertinent.
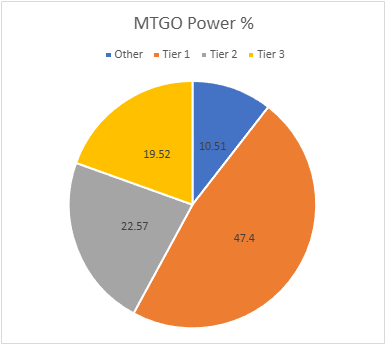
The MTGO Power Tiers
As with the population numbers, total points are down, 3206 to 2464. The adjusted average points were 22.84 therefore 23points made Tier 3. The adjusted STDev was 36.00 so add 36 to the starting point, and Tier 3 runs to 59 points. Tier 2 starts with 60 points and runs to 96. Tier 1 requires at least 97 points. Tier 2 shuffled itself quite a bit, but that was the most dynamism on the MTGO List. Like I said, the online metagame is looking pretty stolid.
| Deck Name | Total Points | Total % |
|---|---|---|
| Tier 1 | ||
| Boros Energy | 523 | 21.22 |
| Jeskai Blink | 168 | 6.82 |
| Amulet Titan | 140 | 5.68 |
| Weapons Affinity | 122 | 4.95 |
| Ruby Storm | 112 | 4.54 |
| Kappa's Cannons | 103 | 4.18 |
| Tier 2 | ||
| Goryo Blink | 85 | 3.45 |
| Tameshi Belcher | 84 | 3.41 |
| Izzet Prowess | 82 | 3.33 |
| Living End | 81 | 3.29 |
| Domain Zoo | 78 | 3.17 |
| Neobrand | 77 | 3.12 |
| Colorless Etron | 69 | 2.80 |
| Tier 3 | ||
| Grixis Reanimator | 50 | 2.03 |
| Green-Based Eldrazi | 50 | 2.03 |
| Dimir Control | 49 | 1.99 |
| Dimir Tempo | 48 | 1.95 |
| Simic Ritual | 46 | 1.87 |
| Broodscale Combo | 46 | 1.87 |
| Esper Blink | 44 | 1.79 |
| Jeskai Control | 40 | 1.62 |
| Jeskai Midrange | 32 | 1.30 |
| RW Ponza | 29 | 1.18 |
| Mardu Blink | 24 | 0.97 |
| UW Control | 23 | 0.93 |
The ongoing competition between Dimir Control and Dimir Tempo for king of Blue-Black is deadlocked. Tempo has been jettisoning utility creatures, while Control has actually diversified its creatures. As I snarked last month, Wan Shi Tong, Librarian has been the most frequent loser in this competition. Parasitic effects like this just don't play well in Modern.
An additional wrinkle is that UW Control is disappearing. I'd prefer to drop the Control name for Prison deck since it's built around both Isochron Scepter and Narset, Parter of Veils locks, but I can't win that fight. However, the deck began to move slightly away from that by moving Jeskai for Galvanic Discharge and one (occasionally two) Phlages. Locking the opponent only wins the game if they concede, so it seems a win condition was in order.
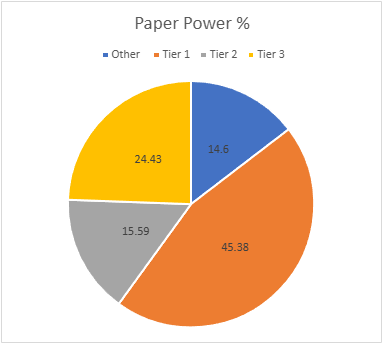
The Paper Power Tiers
Paper's total points rose from 997 to 1007. There was only one three-point event reported in May, and it only reported a Top 16, so points were pretty low for this population size. The adjusted average points were 11.13, setting the cutoff at 11 points. The STDev was 16.57, so add 17 to the starting point and Tier 3 runs to 28 points. Tier 2 starts with 29 points and runs to 46. Tier 1 requires at least 47 points. There was more movement within the Tiers than on MTGO and Mill fell off the list without being replaced.
| Deck Name | Total Points | Total % |
|---|---|---|
| Tier 1 | ||
| Boros Energy | 161 | 15.99 |
| Jeskai Blink | 75 | 7.45 |
| Domain Zoo | 57 | 5.66 |
| Amulet Titan | 56 | 5.56 |
| Izzet Prowess | 54 | 5.36 |
| Weapons Affinity | 54 | 5.36 |
| Tier 2 | ||
| Goryo Blink | 43 | 4.27 |
| Kappa's Cannons | 43 | 4.27 |
| Green-Based Eldrazi | 36 | 3.57 |
| Tameshi Belcher | 35 | 3.48 |
| Tier 3 | ||
| Esper Blink | 26 | 2.58 |
| Colorless Etron | 25 | 2.48 |
| Broodscale Combo | 24 | 2.38 |
| Living End | 23 | 2.28 |
| Jeskai Control | 22 | 2.18 |
| Yawgmoth | 22 | 2.18 |
| Ruby Storm | 21 | 2.08 |
| Simic Ritual | 21 | 2.08 |
| Dimir Tempo | 18 | 1.79 |
| Neobrand | 18 | 1.79 |
| Izzet Cutter | 15 | 1.49 |
| Sam's Ritual | 11 | 1.09 |
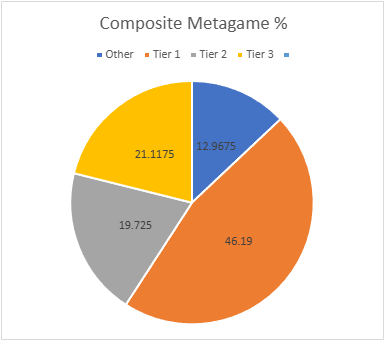
Composite Metagame
That's a lot of data, but what does it all mean? When Modern Nexus was first started, we had a statistical method to combine the MTGO and paper data, but the math of that system doesn't work without big paper events. I tried. Instead, I'm using an averaging system to combine the data. I take the MTGO results and average the tier, then separately average the paper results, then average the paper and MTGO results together for final tier placement.
This generates a lot of partial Tiers. That's not a bug, but a feature. The nuance separates the solidly Tiered decks from the more flexible ones and shows the true relative power differences between the decks. Every deck in the paper and MTGO results is on the table, and when they don't appear in a given category, they're marked N/A. This is treated as a 4 for averaging purposes.
| Deck Name | MTGO Pop Tier | MTGO Power Tier | MTGO Average Tier | Paper Pop Tier | Paper Power Tier | Paper Average Tier | Composite Tier |
|---|---|---|---|---|---|---|---|
| Boros Energy | 1 | 1 | 1 | 1 | 1 | 1 | 1.00 |
| Jeskai Blink | 1 | 1 | 1 | 1 | 1 | 1 | 1.00 |
| Amulet Titan | 1 | 1 | 1 | 1 | 1 | 1 | 1.00 |
| Weapons Affinity | 1 | 1 | 1 | 1 | 1 | 1 | 1.00 |
| Kappa's Cannons | 1 | 1 | 1 | 2 | 2 | 2 | 1.50 |
| Izzet Prowess | 2 | 2 | 2 | 1 | 1 | 1 | 1.50 |
| Domain Zoo | 2 | 2 | 2 | 1 | 1 | 1 | 1.50 |
| Ruby Storm | 1 | 1 | 1 | 3 | 3 | 3 | 2.00 |
| Goryo Blink | 2 | 2 | 2 | 2 | 2 | 2 | 2.00 |
| Tameshi Belcher | 2 | 2 | 2 | 2 | 2 | 2 | 2.00 |
| Colorless Etron | 2 | 2 | 2 | 3 | 3 | 3 | 2.50 |
| Neobrand | 2 | 2 | 2 | 3 | 3 | 3 | 2.50 |
| Living End | 2 | 2 | 2 | 3 | 3 | 3 | 2.50 |
| Green-Based Eldrazi | 3 | 3 | 3 | 2 | 2 | 2 | 2.50 |
| Esper Blink | 3 | 3 | 3 | 2 | 3 | 2.5 | 2.75 |
| Dimir Tempo | 3 | 3 | 3 | 3 | 3 | 3 | 3.00 |
| Jeskai Control | 3 | 3 | 3 | 3 | 3 | 3 | 3.00 |
| Simic Ritual | 3 | 3 | 3 | 3 | 3 | 3 | 3.00 |
| Broodscale Combo | 3 | 3 | 3 | 3 | 3 | 3 | 3.00 |
| Grixis Reanimator | 3 | 3 | 3 | N/A | N/A | N/A | 3.50 |
| Dimir Control | 3 | 3 | 3 | N/A | N/A | N/A | 3.50 |
| RW Ponza | 3 | 3 | 3 | N/A | N/A | N/A | 3.50 |
| Jeskai Midrange | 3 | 3 | 3 | N/A | N/A | N/A | 3.50 |
| UW Control | 3 | 3 | 3 | N/A | N/A | N/A | 3.50 |
| Mardu Blink | 3 | 3 | 3 | N/A | N/A | N/A | 3.50 |
| Yawgmoth | N/A | N/A | N/A | 3 | 3 | 3 | 3.50 |
| Izzet Cutter | N/A | N/A | N/A | 3 | 3 | 3 | 3.50 |
| Sam's Ritual | N/A | N/A | N/A | 3 | 3 | 3 | 3.50 |
| Mill | N/A | N/A | N/A | 3 | N/A | N/A | 3.75 |
It's really weird that the bottom of Tier 3 was so different paper and MTGO. It's pretty common for each to have a few decks that don't appear in the other List, but for 10 decks to do it is unprecedented. Really hammers home how different the two play mediums are.
Average Power Rankings
Finally, we come to the average power rankings. These are found by taking the total points earned and dividing them by total decks, to measure points per deck. I use this to measure strength vs. popularity. Measuring deck strength is hard. While you can make a Wins-Above-Replacement-esq metric for the Magic cards in an individual deck, there's no way to make one that lets you compare decks. The game is too complex, and even then, power is very contextual.
Using the power rankings helps to show how justified a deck’s popularity is. However, more popular decks will still necessarily earn a lot of points. Therefore, the top tier doesn't move much between population and power and obscures whether its decks really earned their position.
This is where the averaging comes in. Decks that earn a lot of points because they get a lot of results will do worse than decks that win more events, indicating which deck actually performs better.
A higher average indicates lots of high finishes, whereas low averages result from mediocre performances and a high population. Lower-tier decks typically do very well here, likely due to their pilots being enthusiasts. Bear this in mind and be careful about reading too much into these results. However, as a general rule, decks that place above the baseline average are over-performing, and vice versa.
How far above or below that average a deck sits justifies its position on the power tiers. Decks well above baseline are undervalued, while decks well below baseline are very popular, but aren't necessarily good.
The Real Story
When considering the average points, the key is looking at how far off a deck is from the Baseline stat (the overall average of points/population). The closer a deck’s performance to the Baseline, the more likely it is to be performing close to its "true" potential.
A deck that is exactly average would therefore perform exactly as well as expected. The greater the deviation from the average, the more a deck under or over-performs. On the low end, a deck’s placing was mainly due to population rather than power, which suggests it’s overrated. A high-scoring deck is the opposite of this.
We'll start with MTGO's averages:
| Deck Name | Average Points | Power Tier |
|---|---|---|
| Green-Based Eldrazi | 2.00 | 3 |
| Simic Ritual | 2.00 | 3 |
| Broodscale Combo | 2.00 | 3 |
| Living End | 1.98 | 2 |
| Esper Blink | 1.91 | 3 |
| Domain Zoo | 1.90 | 2 |
| Jeskai Midrange | 1.88 | 3 |
| Tameshi Belcher | 1.87 | 2 |
| Mardu Blink | 1.85 | 3 |
| Ruby Storm | 1.84 | 1 |
| Amulet Titan | 1.82 | 1 |
| Kappa's Cannons | 1.78 | 1 |
| Boros Energy | 1.75 | 1 |
| Neobrand | 1.75 | 2 |
| Goryo Blink | 1.73 | 2 |
| Weapons Affinity | 1.72 | 1 |
| Dimir Tempo | 1.71 | 3 |
| Dimir Control | 1.69 | 3 |
| Jeskai Blink | 1.68 | 1 |
| Izzet Prowess | 1.67 | 2 |
| Grixis Reanimator | 1.67 | 3 |
| UW Control | 1.64 | 3 |
| RW Ponza | 1.61 | 3 |
| Baseline | 1.61 | |
| Jeskai Control | 1.54 | 3 |
| Colorless Etron | 1.50 | 2 |
The surprise winner of MTGO Deck of April is Ruby Storm, the highest performing Tier 1 deck. This will probably never happen in paper since Storm's much harder to play without MTGO tracking mana and storm count for you.
Now the paper averages:
| Deck Name | Average Points | Power Tier |
|---|---|---|
| Kappa's Cannons | 1.59 | 2 |
| Living End | 1.53 | 3 |
| Neobrand | 1.50 | 3 |
| Colorless Etron | 1.47 | 3 |
| Jeskai Control | 1.47 | 3 |
| Yawgmoth | 1.47 | 3 |
| Weapons Affinity | 1.46 | 1 |
| Jeskai Blink | 1.44 | 1 |
| Amulet Titan | 1.44 | 1 |
| Domain Zoo | 1.42 | 1 |
| Boros Energy | 1.41 | 1 |
| Tameshi Belcher | 1.40 | 2 |
| Ruby Storm | 1.40 | 3 |
| Simic Ritual | 1.40 | 3 |
| Dimir Tempo | 1.38 | 3 |
| Sam's Ritual | 1.37 | 3 |
| Goryo Blink | 1.34 | 2 |
| Tier 1 | 1.34 | |
| Broodscale Combo | 1.33 | 3 |
| Izzet Prowess | 1.29 | 1 |
| Green-Based Eldrazi | 1.29 | 2 |
| Izzet Cutter | 1.25 | 3 |
| Mill | 1.25 | N/A |
| Esper Blink | 1.24 | 3 |
Meanwhile, Weapons Affinity is the paper Deck of April. Drink it in Affinity players, this is the last time this will ever happen.
Analysis
The Modern metagame is heavily combo slanted. I count 10 decks on the MTGO Tier List as either full or partial combo decks and 11 on the paper List. That's 40% and 48% respectively. You can make arguments about whether decks like Izzet Cutter or Mill count too.
That's very significant, and this is all possible thanks to Boros Energy. It dominates the aggro and midrange spaces and is only really weak to combo. Thus, if you want to metagame against Energy, you really have to go combo. I don't think an fraglie, all-in deck like Cosmo Thud is remotely viable in a format where Counterspell sees consistent play.
All that said, I actually expect Boros to decline in May. I've noticed a pattern to qualifying seasons in non-Nadu years which is most pronounced on MTGO but happens in paper too.
The month before the season begins, the presumed (or actual) best deck surges due to testing. During the first few weeks, that surge level is maintained as the best deck is played by the best players. Then it declines. The best players have qualified, so they move on to other fun decks or just don't play.
Many other players abandon the deck in favor of trying to metagame or rogue deck their way to qualification. The last month sees the best deck rise again as the players that didn't qualify rush back, hoping its power will get them qualified anyway.
It happened last year, but we won't know if it's happening this year until August.
Is Blinking Good?
Back to the Blink thread from above: the archetype appears to be in crisis. The rapid decline notwithstanding, April saw considerable confusion about what the deck is even supposed to be. Since the days of Omnath, Locus of Creation piles my definition for Blink was at least two [card]Ephemerate[card]s.
That wasn't relevant from when Omnath vanished until the last week and a half of April, when suddenly Jeskai Blink began cutting down to one or zero Ephemerates. You can't be Blink if you don't Blink (Phelia is flickering), so those gets were recorded as Jeskai Midrange. Literally the only difference between Jeskai Blink and Midrange is the Ephemerate count.
I'm not sure why this has happened. Cheating and reusing value creatures is the archetypes whole shtick. Cutting Ephemerate cuts a card that admittedly is pretty weak on its own, but it also means that Phelia, Exuberant Shepard and Consign to Memory are even more load bearing than before.
This might also explain why Casey Jones, Vigilante has mostly disappeared. He was only good if the discard trigger was Consigned, and as predicted that was a straw too great for the overworked Consign. For the record, Esper Blink is down to two Ephemerates on average and Mardu is going midrange too.
It's pretty clear that Blink is having an identity crisis. I'm guessing that the luster of cheating in Quantum Riddler wore off and they're now seeking a new way forward. The only deck still consistently running a full set of Ephemerate is Goryo Blink.
I'll be watching for whether Jeskai reverts to being a Blink deck or just embraces being midrange in May.
Artificial Menance
Meanwhile, Weapons Manufacturing decks are quietly moving up the Tier List.
Having artifact combo isn't inherently a problem, but the fact that Munitions tokens trigger on leaving the battlefield for any reason feels like an oversight. Once they're made, they can only go off. This makes traditional answers to Affinity like Kataki, War's Wage, Hurkyl's Recall, and even Wrath of the Skies liabilities, and that's always a worry.
There's nothing suggesting that this is a problem at the moment because the decks aren't very consistent. The only cards with real text are Kappa Cannoneer, Weapons Manufacturing, and Pinnacle Emissary. Keep those off the board, then the only threat is Urza's Saga.
However, you can't trust a Mox Opal deck. The right card will bust this deck wide open. Doesn't even have to be an artifact. I've seen it repeatedly. Keep a very close eye on these decks.
Financial Implications
Modern's card market is fairly stable while Standard drives card prices. There is, however, potential for turbulence.
I'm told May 18th is a ban announcement. It's pretty unlikely that Wizards will do anything in the middle of a qualifier season given their stated desire for format stability. However, it isn't impossible. I would be flexible enough to respond to market instability but not at the expense of existing investments.
