
Are you a Quiet Speculation member?
If not, now is a perfect time to join up! Our powerful tools, breaking-news analysis, and exclusive Discord channel will make sure you stay up to date and ahead of the curve.
Welcome back, readers! The inspiration for this week is owed to Sigmund Ausfresser and his article from last week. For those who didn't read it (and I suggest you do), he analyzes the various Commander products using statistical tools. It dawned on me that we have readers with all sorts of backgrounds (some with a lot of math, some without) and it might be helpful to have a thorough article discussing these types of analytical tools.
While there are some people who speculate purely by "feel," I know I personally am not one of them. I am an engineer by trade and I prefer quantitative reasoning for decision making (this isn't a slight against those who just use gut feelings, but more of a personal preference). I never advocate investing in a speculation target that you yourself don't believe in, and one's "gut feeling" isn't transferable to others—however, data-backed decisions are. So now that you understand the reason behind the article let's dig a bit deeper.
Step 1: Data Preparation
Before you can use any sort of analytical tool you need a data set to work with. Luckily we have lots of resources for these (including, of course, good old Trader Tools). The reason we gather data is to do comparisons and determine trends, so it's important to think a bit ahead and determine what types of trends we are going to look for.
For example, say I want to look at the top 10 most played commanders of all time (according to EDHREC), and look for cards in those decks that see a lot of play and are under $3. Knowing this, I'll likely want to focus on artifacts, lands, and mono-colored cards, which allow for the most playability due to the color restriction requirements of the format.
Step 2: Gather Data
The next step is obviously to gather the data we've decided to analyze. According to EDHREC, the following are the top 10 commanders with the most submitted decklists of all time. (Note that doesn't actually guarantee they are the most played, however, there is a logically strong correlation between a lot of decklist submissions and a lot of play.)
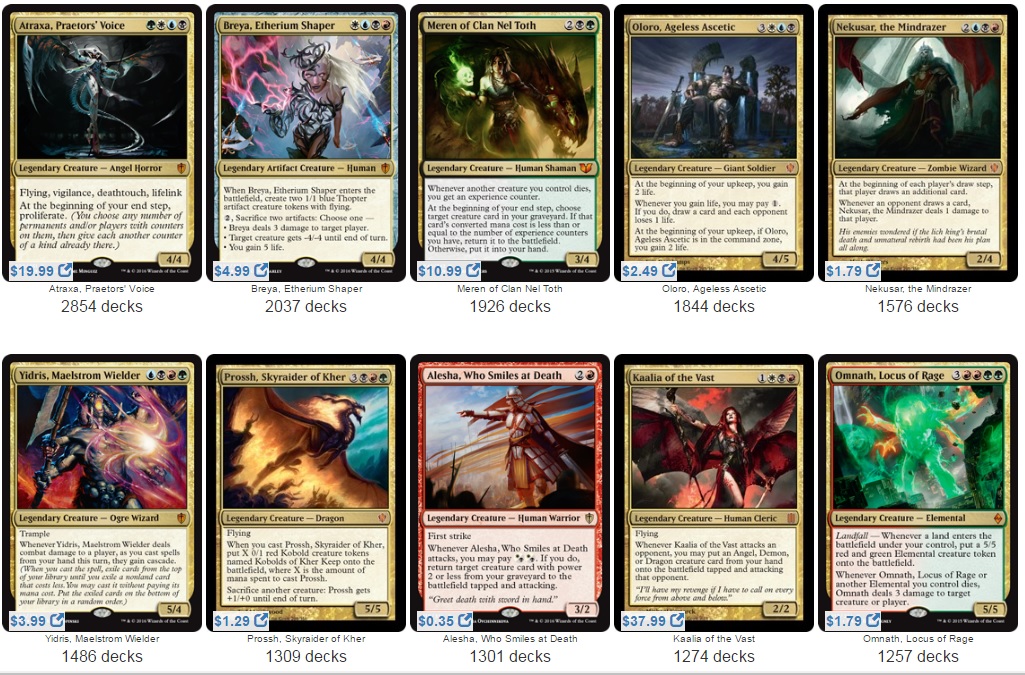
Before we go any further, it is interesting to note that 80% of these came from the Commander products, with only two from a Standard-legal set. All of them were also printed within the last four years. This implies that WoTC is actively focused on appeasing the Commander community, and their latest efforts have borne fruit. It also means that the commanders designed around their Commander products are clearly beloved.
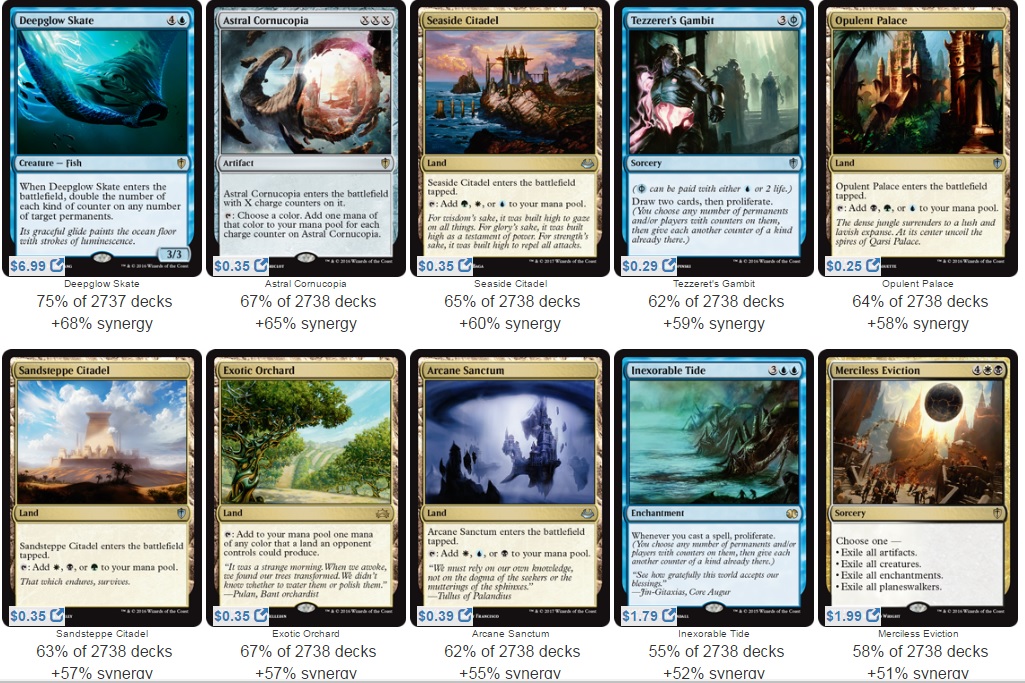
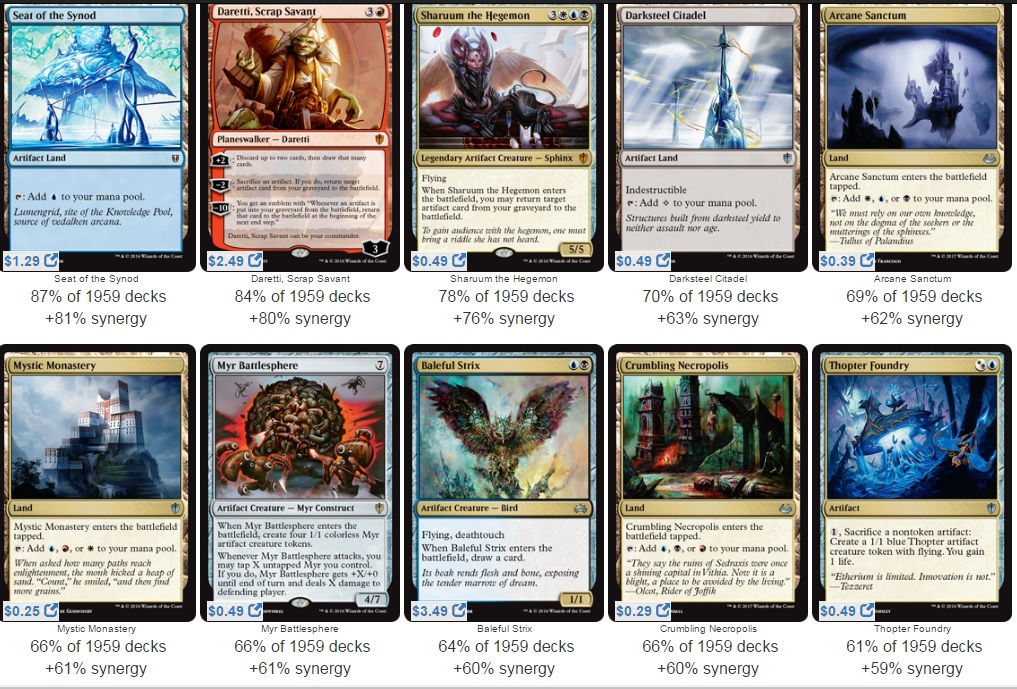
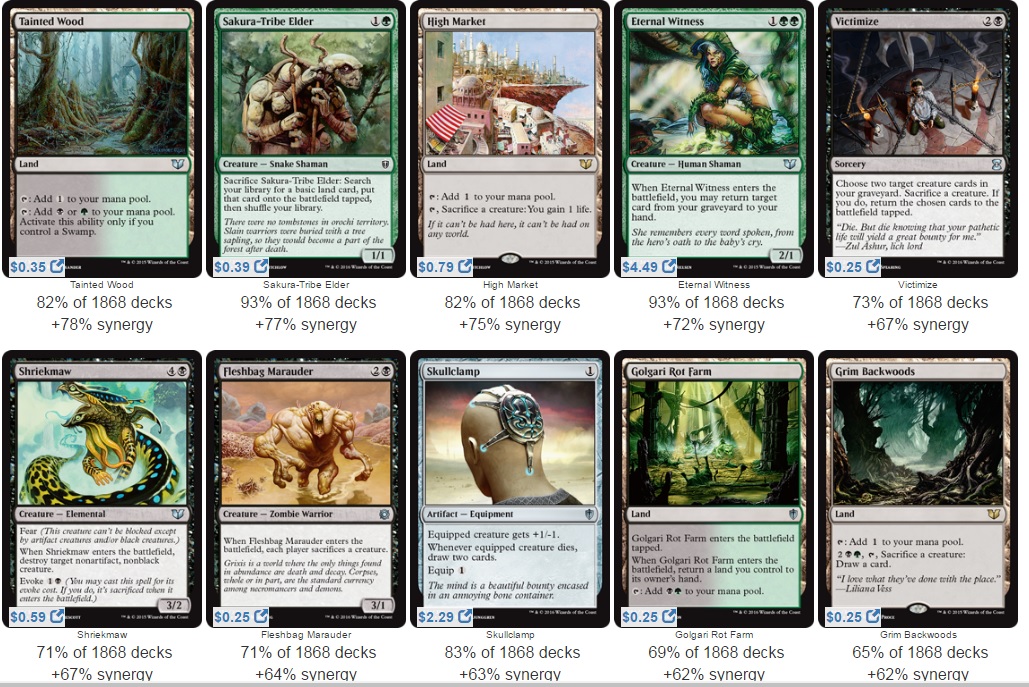
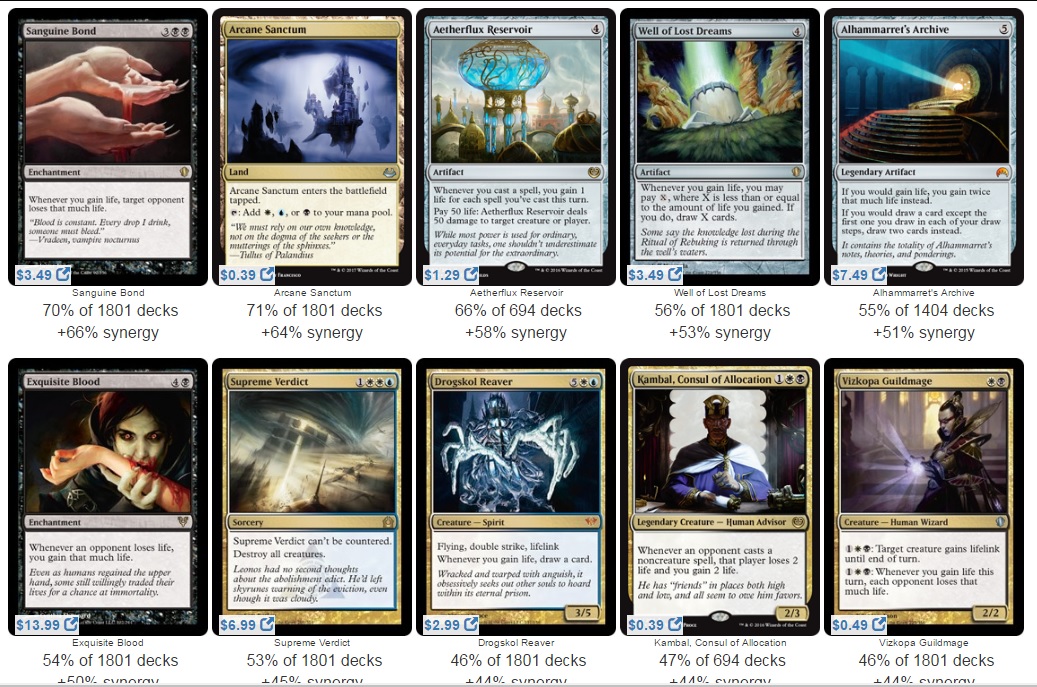
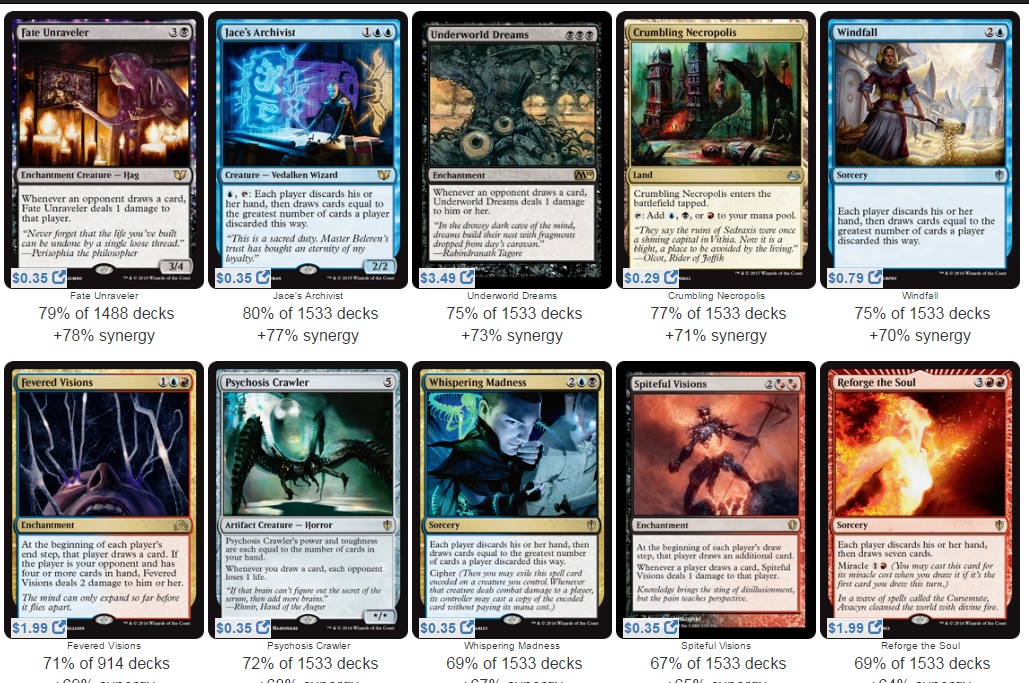
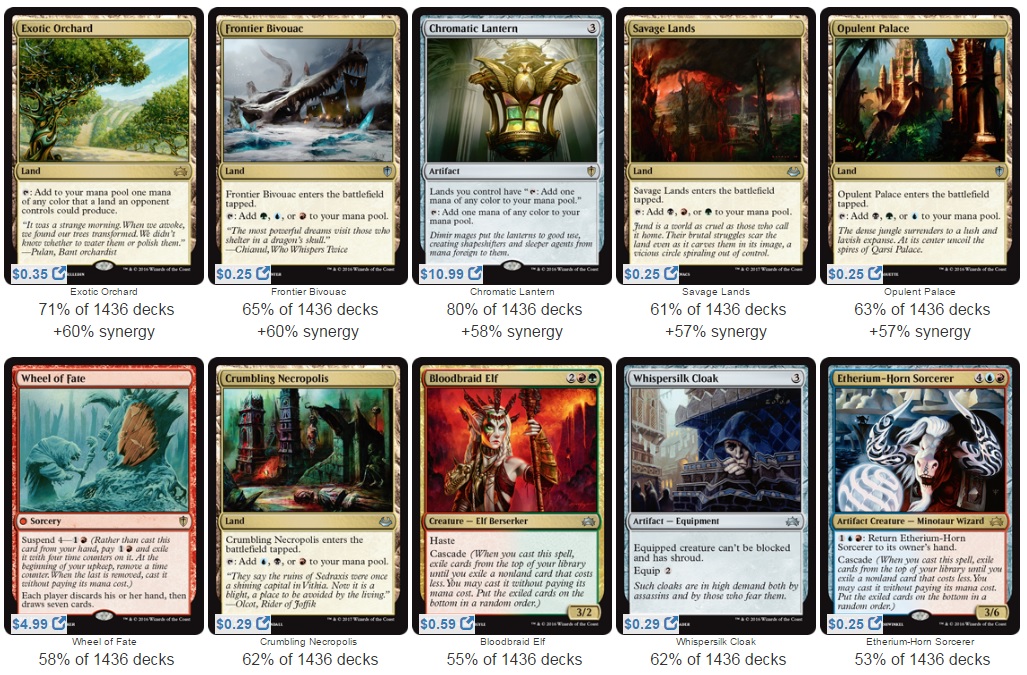
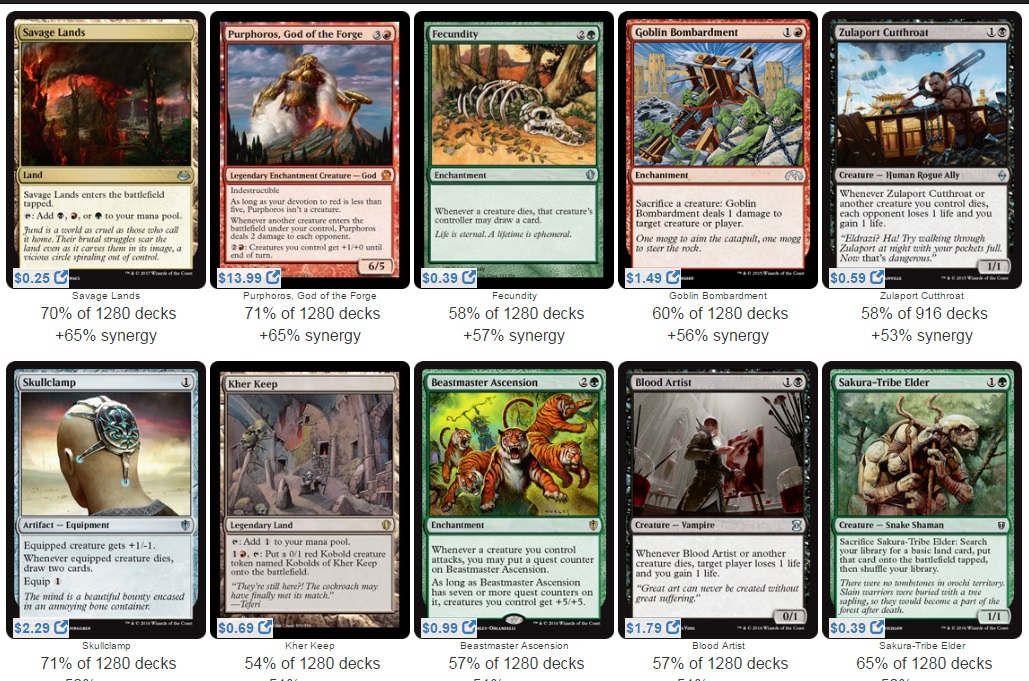
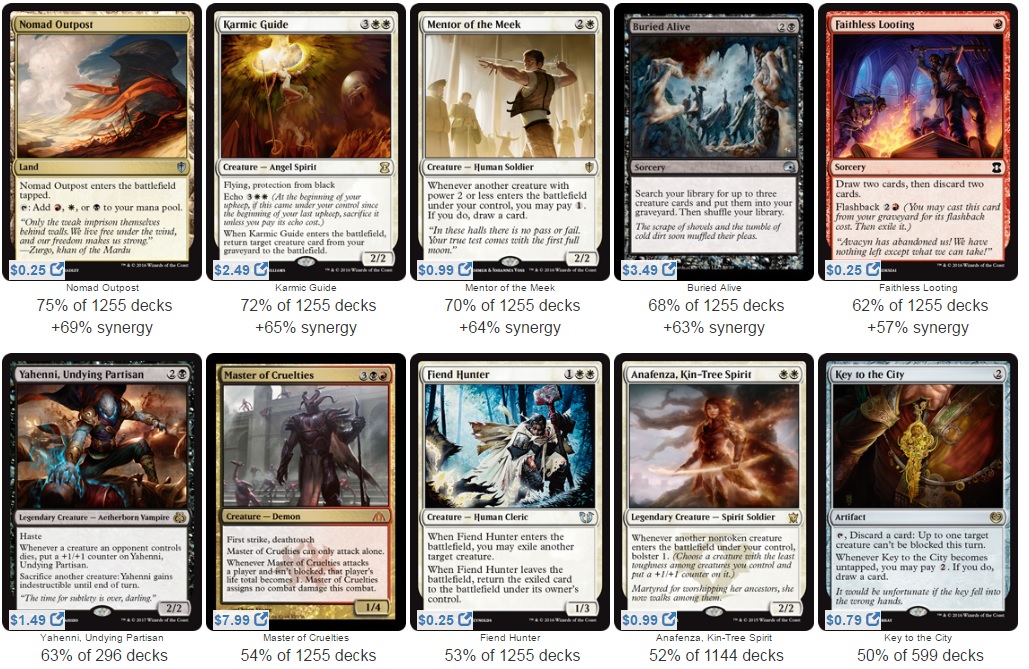
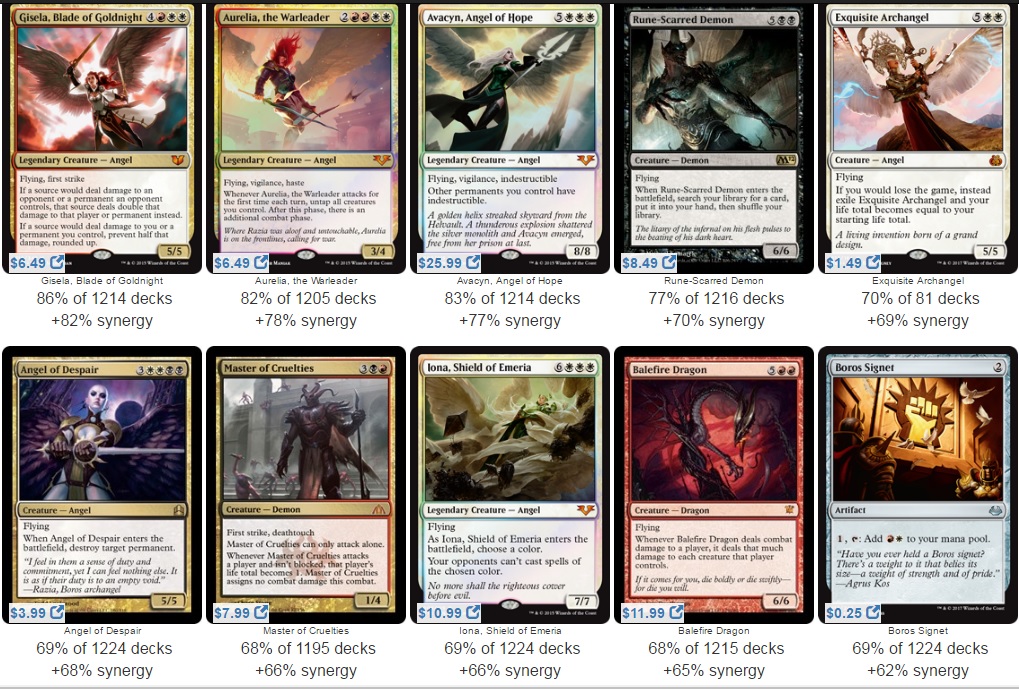
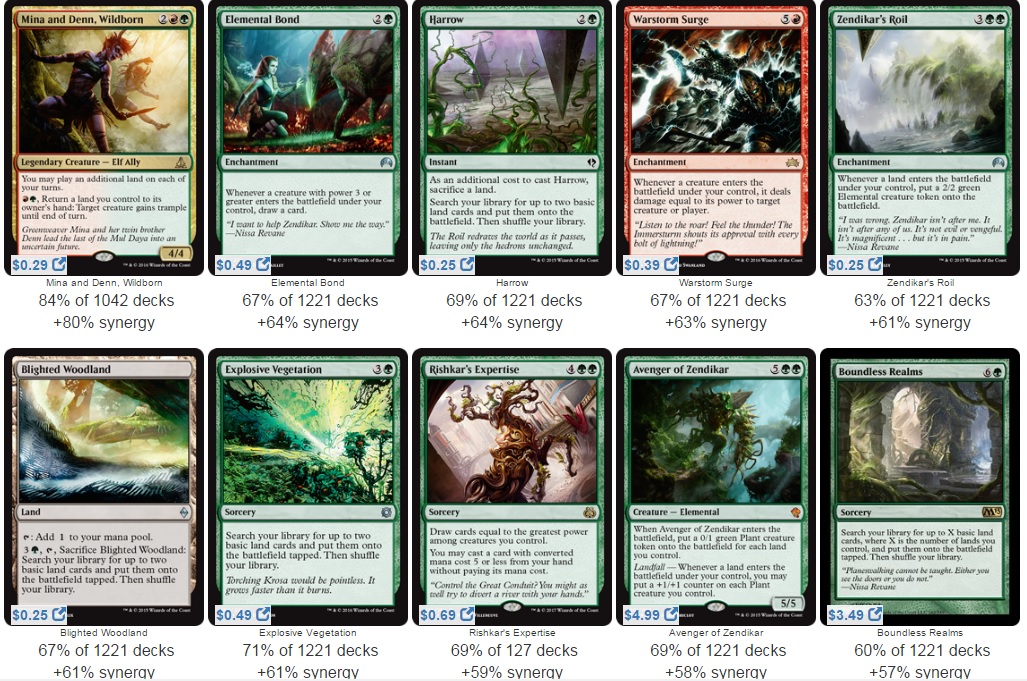
But let's dig into the good stuff. Below are pictures of the top 10 most commonly played cards alongside each respective commander. It's important to keep in mind that all of these commanders vary across the color spectrum, and almost all have very different play styles, so we should expect a lot of different cards.
Atraxa, Praetor's Voice
Breya, Etherium Shaper
Meren of Clan Nel Toth
Oloro, Ageless Ascetic
Nekusar, the Mindrazer
Yidris, the Maelstrom Wielder
Prossh, Skyraider of Kher
Alesha, Who Smiles at Death
Kaalia of the Vast
Omnath, Locus of Rage
Step 3: Filter Data
That is a whole lot of cards, and a prime example of why we had additional criteria to focus in on; otherwise, it's very easy to get lost in the woods. Ignoring the cards that don't meet our initial criteria (under $3), we shrink our list down by 34 cards. But that still leaves a pretty big list.
The filtering step is one that can easily make or break your analysis. If you filter too much, you may have too few data that lead to skewed results. If you don't filter it enough, your trends can get obfuscated simply due to all the data points.
For this example, I'm going to filter out the uncommons less than $0.50 that have been reprinted. So from a little under 100 cards (as there were some duplicates), we are down to the following:
| Card | Price | View Count Rank |
| Astral Cornucopia | 0.35 | 672 |
| Exotic Orchard* | 0.35 | 650 |
| Inexorable Tide | 1.75 | 348 |
| Daretti, Scrap Savant | 2.49 | 68 |
| Myr Battlesphere | 0.49 | 462 |
| High Market | 0.79 | 1048 |
| Shriekmaw | 0.59 | 791 |
| Skullclamp* | 2.29 | 14 |
| Grim Backwoods | 0.25 | 943 |
| Aetherflux Reservoir | 1.29 | 34 |
| Jace's Archivist | 0.35 | 604 |
| Fate Unraveler | 0.35 | 1115 |
| Windfall | 0.79 | 606 |
| Psychosis Crawler | 0.35 | 198 |
| Reforge the Soul | 1.99 | 392 |
| Goblin Bombardment | 1.49 | 750 |
| Zulaport Cutthroat | 0.59 | 119 |
| Kher Keep | 0.69 | 802 |
| Beastmaster Ascension | 0.99 | 66 |
| Blood Artist | 1.79 | 96 |
| Karmic Guide | 2.49 | 99 |
| Mentor of the Meek | 0.99 | 108 |
| Yahenni, Undying Partisan | 1.49 | 118 |
| Anafenza, Kin-Tree Spirit | 0.99 | 304 |
| Key to the City | 0.79 | 1568 |
| Exquisite Archangel | 1.49 | 915 |
| Warstorm Surge | 0.39 | 279 |
| Rishkar's Expertise | 0.69 | 85 |
Asterisks indicate that a card appeared under two commanders. The third column refers to a metric tracked by EDHREC that ranks how often cards are viewed on their site. They tally the number of views and then rank each card in descending order. Lower numbers mean larger view counts. In theory, we can presume that a larger view count is correlated with inclusion in more decks.
Editor's note: An earlier version of this article incorrectly stated that higher numbers corresponded to larger view counts.
Step 4: Analyze the Data
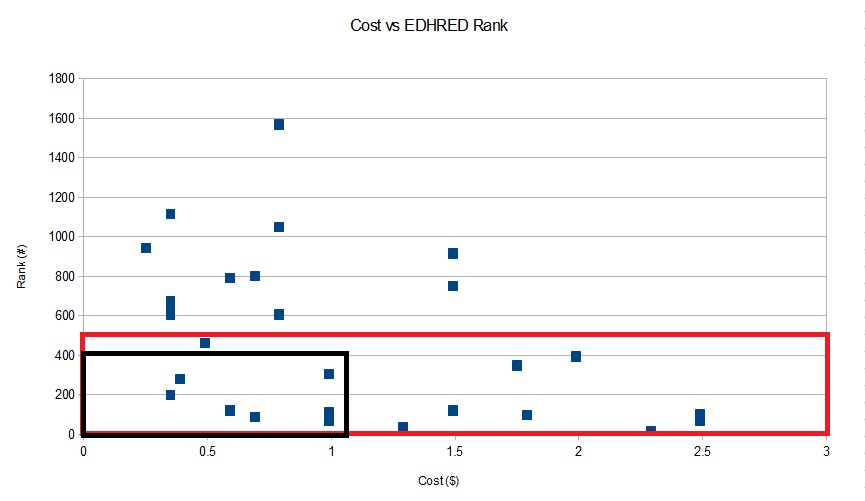
Next we get to the actual analysis. Here we have graphed the cost of each card against the view count rank. The red quadrant shows the cards with the highest ranking (regardless of cost), whereas the black quadrant focuses in on the cards with both a high ranking and a low cost (i.e. the ones with the most promise for growth). The black quadrant includes cards with a ranking of 400 or less that also cost less than $1.
You can obviously set your ranges however small or large you want, but when you run a graph like this your best targets are always in the bottom left-hand corner because they represent the lowest cost and highest rank. You don't need to create a graph to gather this data, but if you are a visual person (like I am) it helps isolate the good targets from the bad.
Looking at the black quadrant, we find seven cards that fit the bill. Interestingly enough, the only uncommon in the group is Zulaport Cutthroat. The rest are rares. The list is below, along with the number of printings for each card.
- Beastmaster Ascension (4 printings)
- Rishkar's Expertise (1 printing)
- Mentor of the Meek (3 printings)
- Zulaport Cutthroat (1 printing)
- Psychosis Crawler (4 printings)
- Warstorm Surge (5 printings)
- Anafenza, Kin-Tree Spirit (1 printing)
Only three of these cards have one printing—two are currently legal in Standard and the third rotated out with the last rotation. Note that the multiple printings of the other cards likely does have an influence on why some fall within this price range, and the recent printings are likely reasons for the others.
Anafenza, Kin-Tree Spirit is probably the most interesting card here, since she's played in some Collected Company decks, so there is additional demand from Modern players. So one could conclude from this analysis that Anafenza, Kin-Tree Spirit might very well be a good card to pick up and speculate on.
Trend Line (Regression Line)
This is only one way to look at the data graphically. When you have a decently sized set of data, you can look for trends (which Sigmund shows in his article) by calculating a regression line for the data.
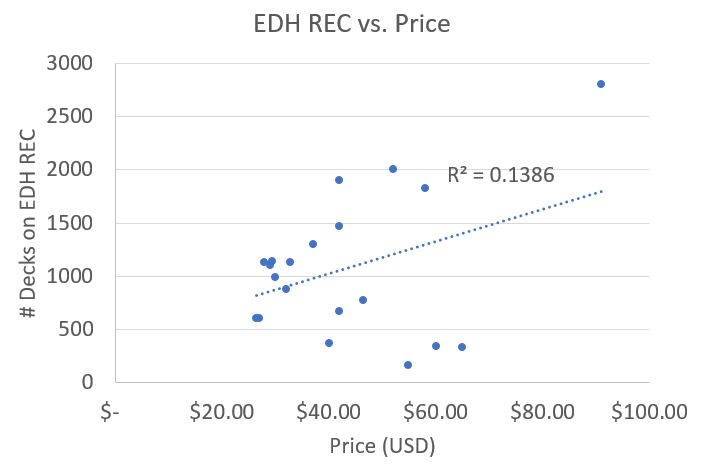
This is one of the graphs Sigmund showed in his article. The dotted line is the "trend line," which is the computer software attempting to apply a linear equation that best explains the data. The R2 value, otherwise known as the coefficient of determination, is the computational results of how close the actual data was to the expected results of the trendline (using the sum of the squares method).
A low R2 value doesn't always mean the data is wrong or bad, but in many cases it does mean that the trendline does not accurately predict the results.
It's critical to understand that the trendline can be heavily swayed by outliers. If you remove the outliers you can often get a much more accurate trendline (and a higher R2 value). This is often critical with large sets of data (where one would expect outliers to be prevalent). For a simple example, see the graph below that I completely made up which includes an outlier and a trendline.
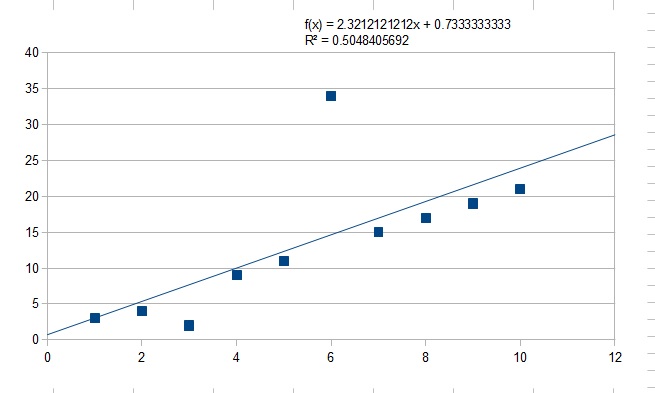
Notice the low R2 value. Now look what happens when we remove the two biggest outliers.
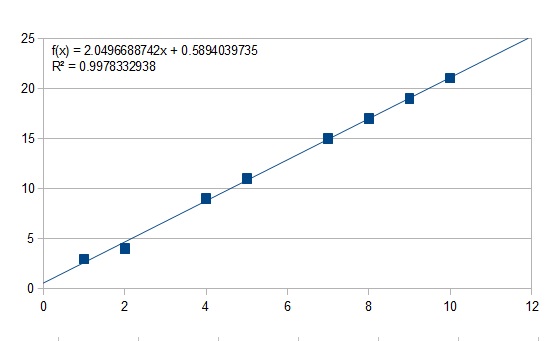
You'll notice this trendline very accurately predicts our data set. The difference lay in correctly recognizing the outliers.
Extrapolation Outside the Range
A word of warning (which was hammered into me during my freshmen and sophomore years studying engineering in college): You can always interpolate from your data set, but never extrapolate.
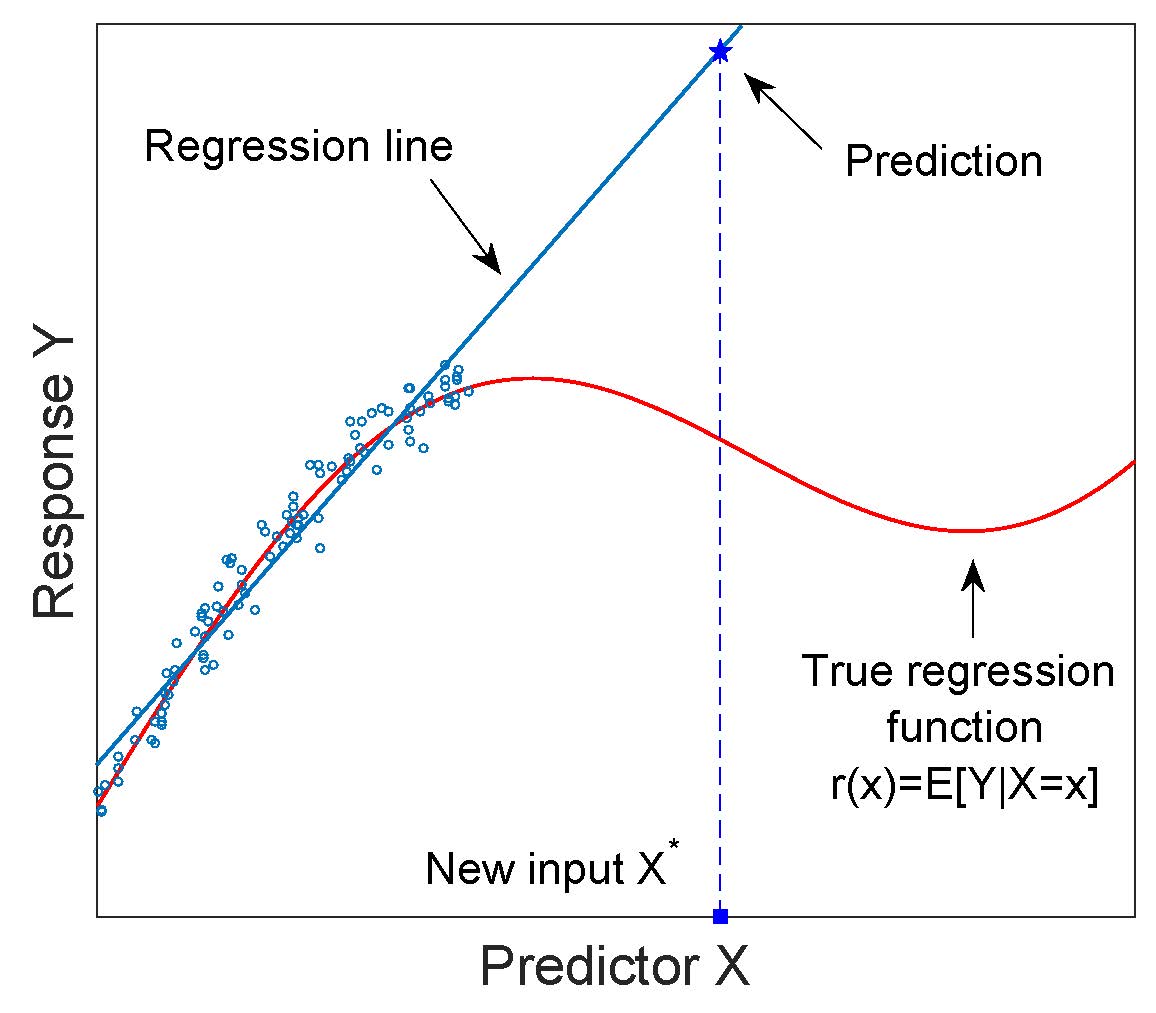
Interpolation means you are drawing conclusions about possible results from within the range of your data set (in this case the numbers 1 through 10). Extrapolation is when you try to draw a conclusion from outside of your data range. You don't want to do that because you are always operating with limited data and you may have only captured a small part of the actual trend.
I've always found this particular aspect best explained visually. If you had a decent-size data set you may get a relatively good regression line that covers your data nicely. However, much further out it might look nothing like your initial trend. Imagine if you decided to graph the amount of water (in mL) per day that you gave a plant vs. its growth height. If you started at, say, 10 mL, and took a bunch of data all the way up to 1L, you might get a regression line like the one below.
Extrapolating this data out, you would say the plant would grow to tremendous heights if I poured a tanker truck worth of water onto it... But in reality, it would just be very, very dead plant, as there are (not surprisingly) diminishing returns on water provisions to plant growth once you reach a certain point.
Conclusion
I really enjoyed Sigmund's analysis from last week, but I realized some people might not exactly have known where he was coming from with some of his tools. I hope that by providing an actual Magic-related example, along with a more clear definition of the statistical tools one can use to analyze data, I've made it easier to take the analytical approach to speculation.

I love the build, David. Thanks for the shoutout! Great detail and theory. You put my column to shame! 🙂
Thanks for the kind words…and thanks for the inspiration.
Nicely written and I thoroughly enjoyed that. I come from a finance background (investment banking risk), where math, models & stats are the very foundation of daily business. In the last 2 years of MTG spec I was surprised to see how little of it exists in the community despite the parallels. I think it is because such methods applies more to eternal formats where there is more time, less variance, and cards generally appreciate. Standard is much more about knowing the domain for short term flips as nearly all standard cards die to bulk.
I believe it is possible to build a portfolio of RL/eternal by looking statistically without even knowing how to play the game. However, such approaches can be cryptic to many without math backgrounds and met with muted response compared to narrative commentary.
A second problem is data. A lot of techniques require full historical time-series data which is very closely guarded by content providers. A while back I did a time-series analysis in response to Pi’s article (https://www.quietspeculation.com/forum/index.php/topic,12214.0.html) but that was only possible after scraping graph data and doing Excel one-off transformations. I’m still baffled why such data is kept secret except for the fact that it costs the content providers themselves to procure; in which case, they can onsell this to interested analysts. Open data is a sign of a mature, liquid market as evidenced by stocks data availability.
Shoey thanks for posting. I would love to discuss some of those financial models (obviously none that are proprietary) as I find the subject very interesting and like you I prefer to use mathematical tools to help evaluate financial decisions (whenever possible).