Are you a Quiet Speculation member?
If not, now is a perfect time to join up! Our powerful tools, breaking-news analysis, and exclusive Discord channel will make sure you stay up to date and ahead of the curve.
As inevitably as the turning of the seasons themselves, it's time for the first Modern metagame update of fall. For many, fall marks the return of the school year, and that always brings weirdness to the data. A number of players have to stop playing while they get their schedules together. However, there are also often more events in September for some reason. This has caused oddities in the past and should be kept in mind this year as well.
The Old Guard Surges
As is becoming customary, there are statistical outliers in the data. However, this month is different from the others. I've gotten used to UR Murktide being the top deck by far and being an outlier to boot. And that continues to be true in paper. Murktide is often followed by other decks, but that isn't true for paper Modern in September. It was close, with Cascade Crashers being just below the statistical line. With Crashers not being an outlier, Hammer Time doesn't qualify either. It's just Murktide outside the trendline.
Magic Online (MTGO) is another matter entirely. There are three outliers this month and Murktide is not the worst offender. Instead, Hammer Time is the big one followed by Murktide, a reversal from the norm, and a return to the standards of 2021. In addition, Rakdos Scam was fairly clearly an outlier despite being well below the other two. As I warned, the data is a bit weird. This might be a fluke, or it might be Rakdos reclaiming the crown it had back in 2020. We'll have to wait and see.
As always, the outliers are excluded from the actual statistical analysis. They’re reported in their correct place on the metagame chart.
September Population Metagame
To make the tier list, a given deck has to beat the overall average population for the month. The average is my estimate for how many results a given deck “should” produce in a given month. Being a tiered deck requires being better than “good enough.” Every deck that posts at least the average number of results is "good enough" and makes the tier list. Then we go one standard deviation (STdev) above average to set the limit of Tier 3 and cutoff for Tier 2. This mathematically defines Tier 3 as those decks clustered near the average. Tier 2 goes from the cutoff to the next standard deviation. These are decks that perform well above average. Tier 1 consists of those decks at least 2 standard deviations above the mean result, encompassing the truly exceptional performing decks.
The MTGO Population Data
In August the adjusted average population was 4.82 setting the Tier 3 cutoff at five decks. This is a very low average, but given the three outliers being excluded, it makes sense. Tier 3, therefore, begins with decks posting 5 results. The STdev was 5.49, which means that Tier 3 runs to 11 results. Again, it's the starting point to the cutoff, then the next whole number for the next Tier. Therefore Tier 2 starts with 12 results and runs to 28. Subsequently, to make Tier 1, 19 decks are required.
To recap, January had 502 decks, February had 436 decks, March only hit 356, April was up to 437, May had 419, June had 481, July was 478, and August was 507 decks. September is a significant anomaly as it only has 404 decks. I'm not sure what happened to the missing 103 decks, but there were fewer MTGO events than in previous months. Naturally, the number of individual decks fell to 59. Of those 59 decks, 22 made the population tier. That's up from August's 18 but can be entirely attributed to the outlier effect.
| Deck Name | Total # | Total % |
|---|---|---|
| Tier 1 | ||
| Hammer Time | 57 | 14.11 |
| UR Murktide | 44 | 10.89 |
| Rakdos Scam | 33 | 8.17 |
| Living End | 21 | 5.20 |
| 4-Color Creativity | 19 | 4.70 |
| Burn | 19 | 4.70 |
| Tier 2 | ||
| Cascade Crashers | 18 | 4.45 |
| Temur Creativity | 17 | 4.21 |
| 4-Color Control | 15 | 3.71 |
| Temur Scapeshift | 12 | 2.97 |
| Tier 3 | ||
| Yawgmoth | 10 | 2.47 |
| UW Control | 10 | 2.47 |
| Glimpse Combo | 10 | 2.47 |
| Grixis Shadow | 9 | 2.23 |
| 4-Color Blink | 8 | 1.98 |
| Amulet Titan | 7 | 1.73 |
| Goblins | 7 | 1.73 |
| Izzet Breach Combo | 6 | 1.48 |
| Mono-Green Tron | 6 | 1.48 |
| Jeskai Breach Combo | 5 | 1.24 |
| Mill | 5 | 1.24 |
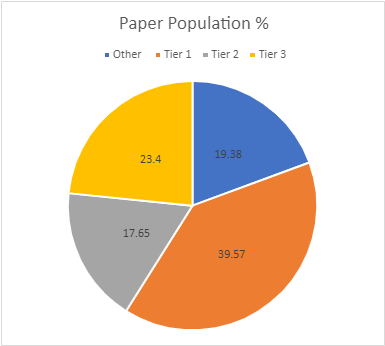
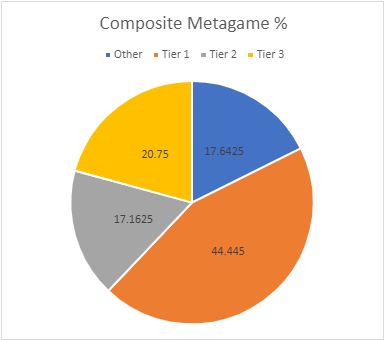
Starting this month, I'm adding in pie charts to help visualize the data. For this first month, it's broken down just by tier, with all the non-tiered decks under Other. I intended this to be deck by deck, but there were so many decks that it was an unreadable mess. I'll be refining these charts in the future.

Scam has replaced Rock as the top Rakdos deck in Modern. The former uses the evoke elementals and Feign Death effects to gain a (theoretically) insurmountable early advantage while the latter is the traditional Jund-style deck. Scam has a lot of Deck-of-the-Month going for it thanks to recent wins, but it is quite high variance. It will be interesting to see if this shift in preferences is maintained.
Indomitable Creativity had a very good month, and if I combined all the variations, it would challenge Murktide. I'll be going into this in detail in this Friday's analysis article, but I'm not convinced this is more than a fluctuation. Underworld Breach also put-up numbers in several forms. Overall, combo decks did quite well in September.
The Paper Population Data
The paper tiers are calculated the same way as the MTGO tiers, just with different data. More paper events are reported each month, but they rarely report more than the Top 8 (sometimes less). However, that doesn't mean that the overall population is lower. July had 783 decks, while June had 640, and August recorded 594. September saw a surge up to 748 decks. It's looking like paper's data is just more volatile than MTGO, which makes sense as paper is decentralized.
Consequently, the number of unique decks is also up. August only managed 83, but September has 94. 26 of those decks made the tier list. The average population was 7.24, so eight decks make Tier 3. The STDev was 11.15, so the increment is 11. I round down if the decimal is less than .20. Therefore, Tier 3 runs from 8 to 19, Tier 2 is 20 to 31, and Tier 1 is 32 and over.
| Deck Name | Total # | Total % |
|---|---|---|
| Tier 1 | ||
| UR Murktide | 75 | 10.03 |
| Hammer Time | 58 | 7.75 |
| Cascade Crashers | 50 | 6.68 |
| Rakdos Scam | 40 | 5.35 |
| Amulet Titan | 37 | 4.95 |
| Living End | 36 | 4.81 |
| Tier 2 | ||
| Burn | 31 | 4.14 |
| 4-Color Creativity | 29 | 3.88 |
| Yawgmoth | 25 | 3.34 |
| 4-Color Control | 24 | 3.21 |
| 4-Color Blink | 23 | 3.07 |
| Tier 3 | ||
| Mono-Green Tron | 19 | 2.54 |
| Grixis Shadow | 16 | 2.14 |
| Jeskai Breach Combo | 15 | 2.00 |
| UW Control | 15 | 2.00 |
| Temur Creativity | 15 | 2.00 |
| Merfolk | 13 | 1.74 |
| Wishshift | 12 | 1.60 |
| Affinity | 11 | 1.47 |
| Temur Scapeshift | 10 | 1.34 |
| Dredge | 9 | 1.20 |
| Grixis Creativity | 8 | 1.07 |
| Glimpse Combo | 8 | 1.07 |
| DnT | 8 | 1.07 |
| Goblins | 8 | 1.07 |
| Domain Zoo | 8 | 1.07 |
As I said above, Crashers is just under the statistical line to be an outlier. Another result would have pushed it over the line. Additionally, Crashers wins the award for most changed deck in September. A new 4-color version emerged to take advantage of Leyline Binding after Dominaria United was released, nearly completely overtaking the traditional Temur version online. Then the MTGO players started brewing, and Crashing Footfalls is becoming another Omnath, Locus of Creation pile.
September Power Metagame
Tracking the metagame in terms of population is standard practice. But how do results actually factor in? Better decks should also have better results. In an effort to measure this, I use a power ranking system in addition to the prevalence list. By doing so, I measure the relative strengths of each deck within the metagame. The population method gives a deck that consistently just squeaks into the Top 32 the same weight as one that Top 8's. Using a power ranking rewards good results and moves the winningest decks to the top of the pile and better reflects their metagame potential.
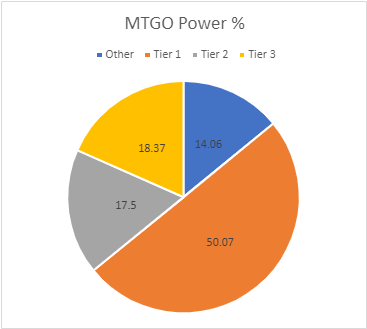
The MTGO Power Tiers
For the MTGO data, points are awarded based on the population of the event. Preliminaries award points based on record (1 for 3 wins, 2 for 4 wins, 3 for 5), and Challenges are scored 3 points for Top 8, 2 for Top 16, and 1 for Top 32. If I can find them, non-Wizards events will be awarded points the same as Challenges or Preliminaries depending on what the event in question reports/behaves like. Super Qualifiers and similar higher-level events get an extra point and so do other events if they’re over 200 players, with a fifth point for going over 400 players. There were no four-point events, but the Showcase Qualifier hit the five-point threshold. Consequently, it had an outsized effect on the data.
Total points fell significantly, as with the population, from 871 to 697. The adjusted average points were 8.58 Therefore 9 points made Tier 3. The STDev was 10.01, which is a bit low, but understandable in context. Thus add 10 to the starting point and Tier 3 runs to 19 points. Tier 2 starts with 20 points and runs to 30. Tier 1 requires at least 31 points.
Mill failed to make the power tier. It was replaced by Eldrazi Tron. Affinity also made the power tier, upping the total MTGO tiered decks to 23.
| Deck Name | Total # | Total % |
|---|---|---|
| Tier 1 | ||
| Hammer Time | 91 | 13.06 |
| UR Murktide | 67 | 9.61 |
| Rakdos Scam | 58 | 8.32 |
| 4-Color Creativity | 36 | 5.16 |
| Temur Creativity | 34 | 4.88 |
| Living End | 33 | 4.73 |
| Tier 2 | ||
| Cascade Crashers | 30 | 4.30 |
| Burn | 29 | 4.16 |
| 4-Color Control | 28 | 4.02 |
| Temur Scapeshift | 23 | 3.30 |
| Yawgmoth | 22 | 3.16 |
| UW Control | 20 | 2.87 |
| Tier 3 | ||
| Grixis Shadow | 18 | 2.58 |
| Amulet Titan | 18 | 2.58 |
| Glimpse Combo | 17 | 2.44 |
| 4-Color Blink | 15 | 2.15 |
| Goblins | 12 | 1.72 |
| Izzet Breach Combo | 11 | 1.58 |
| Etron | 10 | 1.43 |
| Mono-Green Tron | 9 | 1.29 |
| Jeskai Breach Combo | 9 | 1.29 |
| Affinity | 9 | 1.29 |
The outlier gap is about the same for power as population, which is unusual. Frequently the gap looks worse in power terms than in population. I make the outlier decision based only on the population as it's the most objective measurement, but power does serve to highlight the scope of the warp on MTGO. There were a number of decks bubbling out of Tiers 1 and 3 into Tier 2 this month.
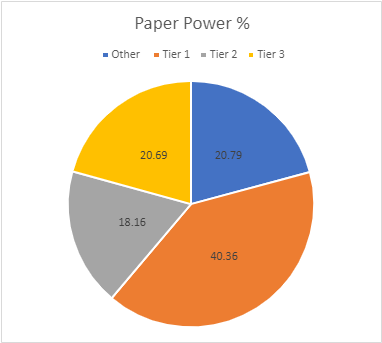
The Paper Power Tiers
Unlike with population, the paper power data works differently than the equivalent MTGO data. The data reported is usually limited to the Top 8 lists, even for big events. Not that I know how big most events are, as that number doesn't always get reported. In other cases, decks are missing. Applying the MTGO point system just doesn't work when I don't know how many points to award and there are data gaps.
Thus, I award points based on the size of the tournament rather than placement. That way I'm being internally consistent with the paper results. The current system is that for events that don't report their starting populations or are under 50 players, I'm giving out 1 point. 51-300 players get 2 points. 301 and above get 3 points. I chose these levels based on the rarity of events over 300 compared to 100-200 and the fact that events under 300 tend to be local events in large cities. It feels like it should be 300 for truly unique events, despite there being no Grand Prix yet. I am currently reevaluating this system given how paper is evolving.
There were a huge number of events awarding 2 points in July and several 3-point events as well. Altogether September had 1068 points, well up from August's 861 points. Not having to exclude team events will do that.
The adjusted average points were 10.35. This sets the cutoff at 11 decks. The STDev was 16.52, thus adding 17 to the starting point and Tier 3 runs to 28 points. Tier 2 starts with 29 points and runs to 46. Tier 1 requires at least 47 points. The total decks fell from 26 to 23. Death and Taxes, Affinity, and Domain Zoo failed to win enough to make the power tier.
| Deck Name | Total # | Total % |
|---|---|---|
| Tier 1 | ||
| UR Murktide | 105 | 9.83 |
| Hammer Time | 82 | 7.68 |
| Cascade Crashers | 75 | 7.02 |
| Rakdos Scam | 62 | 5.80 |
| Living End | 57 | 5.34 |
| Amulet Titan | 50 | 4.68 |
| Tier 2 | ||
| Burn | 46 | 4.31 |
| 4-Color Creativity | 41 | 3.84 |
| Yawgmoth | 38 | 3.55 |
| 4-Color Control | 36 | 3.37 |
| 4-Color Blink | 33 | 3.09 |
| Tier 3 | ||
| Jeskai Breach Combo | 27 | 2.53 |
| Mono-Green Tron | 25 | 2.34 |
| UW Control | 25 | 2.34 |
| Grixis Shadow | 23 | 2.15 |
| Temur Creativity | 20 | 1.88 |
| Wishshift | 18 | 1.68 |
| Temur Scapeshift | 17 | 1.59 |
| Merfolk | 16 | 1.50 |
| Dredge | 15 | 1.40 |
| Affinity | 13 | 1.22 |
| Grixis Creativity | 11 | 1.03 |
| Glimpse Combo | 11 | 1.03 |
Average Power Rankings
Finally, we come to the average power rankings. These are found by taking the total points earned and dividing them by total decks, to measure points per deck. I use this to measure strength vs. popularity. Measuring deck strength is hard. There is no Wins-Above-Replacement metric for Magic, and I'm not certain that one could be credibly devised. The game is too complex, and even then, power is very contextual. Using the power rankings certainly helps and serves to show how justified a deck’s popularity is. However, more popular decks will still necessarily earn a lot of points. Which tracks, but also means that the top tier doesn't move much between population and power, and obscures whether they really earned their position.
This is where the averaging comes in. Decks that earn a lot of points because they get a lot of results will do worse than decks that win more events, indicating which deck actually performs better. A higher average indicates lots of high finishes, whereas low averages result from mediocre performances and a high population. Lower-tier decks typically do very well here, likely due to their pilots being enthusiasts. Bear this in mind, and be careful about reading too much into these results. However, as a general rule, decks which place above the baseline average are overperforming and vice versa. How far above or below that average determines how "justified" a deck's position is on the power tiers. Decks well above baseline are therefore undervalued while decks well below baseline are very popular but aren't necessarily good.
The Real Story
When considering the average points, the key is looking at how far-off a deck is from the Baseline stat (the overall average of points/population). The closer a deck’s performance to the Baseline, the more likely it is to be performing close to its “true” potential. A deck that is exactly average would therefore perform exactly as well as expected. The greater the deviation from average, the more a deck under or over-performs. On the low end, a deck’s placing was mainly due to population rather than power, which suggests it’s overrated. A high-scoring deck is the opposite of this.
I'll begin with the average for MTGO:
| Deck Name | Average Power | Power Tier |
|---|---|---|
| Amulet Titan | 2.57 | 3 |
| Etron | 2.50 | 3 |
| Affinity | 2.25 | 3 |
| Yawgmoth | 2.20 | 2 |
| Temur Creativity | 2.00 | 1 |
| UW Control | 2.00 | 2 |
| Grixis Shadow | 2.00 | 3 |
| Temur Scapeshift | 1.92 | 2 |
| 4-Color Creativity | 1.89 | 1 |
| 4-Color Control | 1.87 | 2 |
| 4-Color Blink | 1.87 | 3 |
| Izzet Breach Combo | 1.83 | 3 |
| Jeskai Breach Combo | 1.80 | 3 |
| Rakdos Scam | 1.76 | 1 |
| Goblins | 1.71 | 3 |
| Glimpse Combo | 1.70 | 3 |
| Cascade Crashers | 1.67 | 1 |
| Baseline | 1.65 | |
| Hammer Time | 1.60 | 1 |
| Living End | 1.57 | 1 |
| Burn | 1.53 | 2 |
| UR Murktide | 1.52 | 1 |
| Mono-Green Tron | 1.50 | 3 |
Pat yourself on the back Temur Creativity, as the best performing Tier 1 deck, you're deck of the month! Of course, don't let it go to your head, your average is thanks to a great overall result in the Showcase Challenge, not consistent performance.
Then the average for paper:
| Deck Name | Average Power | Power Tier |
|---|---|---|
| Jeskai Breach Combo | 1.80 | 3 |
| Temur Scapeshift | 1.70 | 3 |
| UW Control | 1.67 | 3 |
| Dredge | 1.67 | 3 |
| Living End | 1.58 | 1 |
| Rakdos Scam | 1.55 | 1 |
| Yawgmoth | 1.52 | 2 |
| Cascade Crashers | 1.50 | 1 |
| 4-Color Control | 1.50 | 2 |
| Wishshift | 1.50 | 3 |
| Burn | 1.48 | 2 |
| Grixis Shadow | 1.44 | 3 |
| 4-Color Blink | 1.43 | 2 |
| Hammer Time | 1.41 | 1 |
| 4-Color Creativity | 1.41 | 2 |
| UR Murktide | 1.40 | 1 |
| Grixis Creativity | 1.37 | 3 |
| Glimpse Combo | 1.37 | 3 |
| Amulet Titan | 1.35 | 1 |
| Baseline | 1.34 | |
| Temur Creativity | 1.33 | 3 |
| Mono-Green Tron | 1.32 | 3 |
| Merfolk | 1.23 | 3 |
| Affinity | 1.18 | 3 |
Kudos to Living End for continuing to perform despite the changing metagame. Endurance is clearly insufficient graveyard hate.
Composite Metagame
That's a lot of data, but what does it all mean? When Modern Nexus first started, we had a statistical method to combine the MTGO and paper data, but the math of that system doesn't work without big paper events. I tried. Instead, I'm using an averaging system to combine the data. I take the MTGO results and average the tier, then separately average the paper results, then average the paper and MTGO results together for final tier placement.
This generates a lot of partial Tiers. That's not a bug, it's a feature. The nuance separates the solidly Tiered decks from the more flexible ones and shows the true relative power differences between the decks. Every deck in the paper and MTGO results is on the table, and when they don't appear in a given category, they're marked N/A. This is treated as a 4 for averaging purposes.
| Deck Name | MTGO Population Tier | MTGO Power Tier | MTGO Average Tier | Paper Population Tier | Paper Power Tier | Paper Average Tier | Composite Tier |
|---|---|---|---|---|---|---|---|
| Hammer Time | 1 | 1 | 1.00 | 1 | 1 | 1.00 | 1.00 |
| UR Murktide | 1 | 1 | 1.00 | 1 | 1 | 1.00 | 1.00 |
| Rakdos Scam | 1 | 1 | 1.00 | 1 | 1 | 1.00 | 1.00 |
| Living End | 1 | 1 | 1.00 | 1 | 1 | 1.00 | 1.00 |
| Cascade Crashers | 2 | 1 | 1.50 | 1 | 1 | 1.00 | 1.25 |
| 4-Color Creativity | 1 | 1 | 1.00 | 2 | 2 | 2.00 | 1.50 |
| Burn | 1 | 2 | 1.50 | 2 | 2 | 2.00 | 1.75 |
| 4-Color Control | 2 | 2 | 2.00 | 2 | 2 | 2.00 | 2.00 |
| Amulet Titan | 3 | 3 | 3.00 | 1 | 1 | 1.00 | 2.00 |
| Temur Creativity | 2 | 1 | 1.50 | 3 | 3 | 3.00 | 2.25 |
| Yawgmoth | 3 | 2 | 2.50 | 2 | 2 | 2.00 | 2.25 |
| Temur Scapeshift | 2 | 2 | 2.00 | 3 | 3 | 3.00 | 2.50 |
| 4-Color Blink | 3 | 3 | 3.00 | 2 | 2 | 2.00 | 2.50 |
| UW Control | 3 | 2 | 2.50 | 3 | 3 | 3.00 | 2.75 |
| Glimpse Combo | 3 | 3 | 3.00 | 3 | 3 | 3.00 | 3.00 |
| Grixis Shadow | 3 | 3 | 3.00 | 3 | 3 | 3.00 | 3.00 |
| Mono-Green Tron | 3 | 3 | 3.00 | 3 | 3 | 3.00 | 3.00 |
| Jeskai Breach Combo | 3 | 3 | 3.00 | 3 | 3 | 3.00 | 3.00 |
| Goblins | 3 | 3 | 3.00 | 3 | N/A | 3.50 | 3.25 |
| Affinity | N/A | 3 | 3.50 | 3 | 3 | 3.00 | 3.25 |
| Izzet Breach Combo | 3 | 3 | 3.00 | N/A | N/A | N/A | 3.50 |
| Dredge | N/A | N/A | N/A | 3 | 3 | 3.00 | 3.50 |
| Wishshift | N/A | N/A | N/A | 3 | 3 | 3.00 | 3.50 |
| Grixis Creativity | N/A | N/A | N/A | 3 | 3 | 3.00 | 3.50 |
| Merfolk | N/A | N/A | N/A | 3 | 3 | 3.00 | 3.50 |
| Mill | 3 | N/A | 3.50 | N/A | N/A | N/A | 3.75 |
| Etron | N/A | 3 | 3.50 | N/A | N/A | N/A | 3.75 |
| Death and Taxes | N/A | N/A | N/A | 3 | N/A | 3.50 | 3.75 |
| Domain Zoo | N/A | N/A | N/A | 3 | N/A | 3.50 | 3.75 |
The three constants of the post-Lurrus of the Dream-Den metagame continue to hold onto their overall Tier 1 positions. That Living End, Murktide, and Hammer have been doing this for this long in Modern is something to keep an eye on.
Things Are Getting Weird
Leyline Binding is making considerable waves in Modern and many three-color decks are now four or five colors just for that card. This is spreading out the Omnath players even more than they previously were. Which is making it harder to guess where Modern is actually headed.
QS Insiders can tune in this Friday when I unpack some of this month's data and share my thoughts on its implications. If you're not an Insider, consider subscribing today!
