Are you a Quiet Speculation member?
If not, now is a perfect time to join up! Our powerful tools, breaking-news analysis, and exclusive Discord channel will make sure you stay up to date and ahead of the curve.
The latest banning has shaken Modern up dramatically. The cascade decks have all fallen but have not vanished completely. In their wake, players are readjusting and experimenting, which in turn means that a number of new decks have arisen. The Tier List has changed a lot, and given the performance of many of those decks, I expect April's list to be dramatically different as well.
The Anomalous Outlier
After months of outliers in all play mediums thanks, there's only one in March. Yawgmoth was flagged as an outlier in the paper results, and so per policy, was removed from the analysis. It remains in its proper position on the Tier list. However, I'm not sure that it actually counts.
Due to the mid-month ban and Easter, March's paper data is quite low. Had paper's data been more in line with other months, the gap that is present would have been insufficient for Yawgmoth to be considered an outlier. However, as the population is so low, the stats are clear. I'm bringing this up so the Yawg players don't get a big head and/or players freak out about its numbers.
March Population Metagame
To make the tier list, a given deck has to beat the overall average population for the month. The average is my estimate for how many results a given deck "should" produce in a given month. Being a tiered deck requires being better than "good enough". Every deck that posts at least the average number of results is "good enough" and makes the tier list.
Then we go one standard deviation (STdev) above average to set the limit of Tier 3 and the cutoff for Tier 2. This mathematically defines Tier 3 as those decks clustered near the average. Tier 2 goes from the cutoff to the next standard deviation. These are decks that perform well above average. Tier 1 consists of those decks at least two standard deviations above the mean result, encompassing the truly exceptional performing decks.
The MTGO data nearly exclusively comes from official Preliminary and Challenge results. Leagues are excluded, as they add analytically useless bulk data to both the population and power tiers. The paper data comes from any source I can find, with all reported events being counted.
While the MTGO events report predictable numbers, paper events can report anything from only the winner to all the results. In the latter case, if match results aren't included, I'll take as much of the Top 32 as possible. If match results are reported, I'll take winning record up to Top 32, and then any additional decks tied with 32nd place, as tiebreakers are a magic most foul and black.
A Note on the Data
Daybreak is now releasing the total results from every MTGO Preliminary, Challenge, and League 5-0. After some experimentation, I'm sticking to just using the Challenge Top 32 results and 3-1 or better from the Preliminaries. The first reason is that, ultimately, nothing changed. The population metagame list didn't change between my normal method and the experimental versions. Various treatments for the power metagame did change the order of the tier list, but the composition varied only marginally.
The second reason was that dealing with all that data is significantly more work, even with automation. I'm not a great programmer but setting up and training the bots and then auditing the results took significantly longer than my current system, and I'd have to redo it monthly. Since it made little difference, I'm not going to make more work for myself. There are other sites that put together winrates with all the new data anyway, so I don't feel that anything's being lost. It also means that comparing the paper to MTGO results is easier.
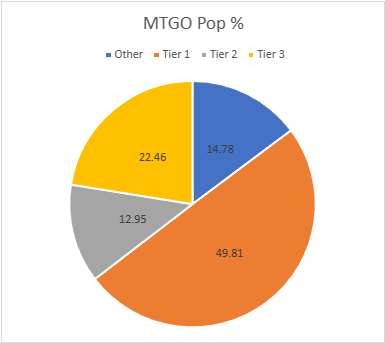
The MTGO Population Data
March's average population for MTGO was 12.11, setting the Tier 3 cutoff at 12 decks. I always round down if the decimal is less than .20. Tier 3, therefore, begins with decks posting 12 results. The STdev was 23.97, so add 23 and that means Tier 3 runs to 35 results. Again, it's the starting point to the cutoff, then the next whole number for the next Tier. Therefore Tier 2 starts with 36 results and runs to 59. Subsequently, to make Tier 1, 60 decks are required.
Despite losing almost two weeks of data, the MTGO sample is still quite robust. It was Last Chance Qualifier time again, and all those events propped up the numbers. January had 1,400 decks, February was 1225, and March tops out at 1042. Turns out, if you schedule more events players will turn out. Take notes, Wizards Organized Play. Assuming you still exist.
The death of the default best deck has brought more diversity, if only because players are actually willing to experiment now. The total number of decks in my data set is down from 88 to 86, but with the lower population this means an increase in the unique deck ratio from .071 to .082. 21 decks made the Tier List up from 18 in February.
| Deck Name | Total # | Total % |
|---|---|---|
| Tier 1 | ||
| Goryo Blink | 101 | 9.69 |
| Mono-Green Tron | 94 | 9.02 |
| Yawgmoth | 91 | 8.73 |
| Rakdos Scam | 86 | 8.25 |
| Counter Cat | 75 | 7.20 |
| Amulet Titan | 72 | 6.91 |
| Tier 2 | ||
| Izzet Murktide | 55 | 5.28 |
| Domain Murktide | 44 | 4.22 |
| 4-C Creativity | 36 | 3.45 |
| Tier 3 | ||
| Rack Scam | 33 | 3.17 |
| Mill | 27 | 2.59 |
| Bant Rhinos | 27 | 2.59 |
| UW Control | 22 | 2.11 |
| Hardened Scales | 22 | 2.11 |
| Coffers | 21 | 2.01 |
| Living End | 16 | 1.53 |
| Wrenn White Blue | 15 | 1.44 |
| Hammer Time | 14 | 1.34 |
| Burn | 13 | 1.25 |
| Wishshift | 12 | 1.15 |
| Domain Zoo | 12 | 1.15 |
If I was as lazy as MTGGoldfish and the other sites and lumped Counter Cat, Domain Murktide, Domain Zoo, and everything else that gets lumped together under the Domain Zoo banner then that deck would be #1 by quite a large margin. However, I have professional pride. Domain Murktide came on quite strong in the last two weekends and is on trajectory to replace Counter Cat as the top performer. Keep an eye on this deck.
Goryo Blink takes the top slot thanks to the first week after Violent Outburst was banned. About half of its total results came between March 11 and March 17. Apparently, the online grinders assumed that it was the new best deck and mass adopted it, only to discover they were wrong. As will be apparent in the power and average power tiers, Goryo Blink did not perform up to expectations. I wouldn't expect it to disappear from Modern, but it should fall down the Tier List in April.
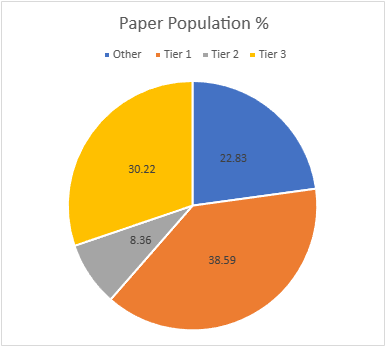
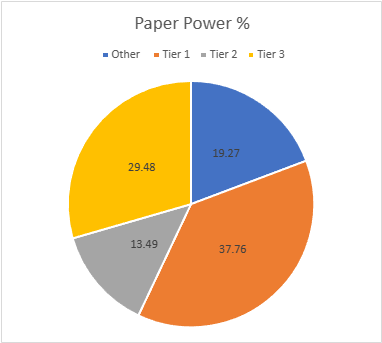
The Paper Population Data
As previously mentioned, March has a tiny paper dataset. Where January had 803 decks and February 890, March only managed 311. Losing the first two weekends to the ban really hurt. Couple that with Easter the last weekend and there just weren't that many events. It just do be like that sometimes.
With the tiny dataset, diversity appears to be up, but much like with the outlier that's a function more of the dataset's size than a reflection of reality. February has 102 unique decks and a ratio of .114, while March has 63 and a ratio of .203. Tiered decks fell slightly from 19 to 17, which is honestly really good all things considered. The adjusted average population was 4.48, so 5 results make the list. The adjusted STDev was 5.66, so the increment is 6. Therefore, Tier 3 runs from 5 to 11, Tier 2 is 12 to 18, and Tier 1 is 19 and over.
| Deck Name | Total # | Total % |
|---|---|---|
| Tier 1 | ||
| Yawgmoth | 33 | 10.61 |
| Amulet Titan | 25 | 8.04 |
| Counter Cat | 23 | 7.39 |
| Goryo Blink | 20 | 6.43 |
| Izzet Murktide | 19 | 6.11 |
| Tier 2 | ||
| Rakdos Scam | 14 | 4.50 |
| Coffers | 12 | 3.86 |
| Tier 3 | ||
| 4-C Creativity | 11 | 3.54 |
| UW Control | 11 | 3.54 |
| Hammer Time | 10 | 3.21 |
| Merfolk | 9 | 2.89 |
| Bant Rhinos | 9 | 2.89 |
| MG Tron | 9 | 2.89 |
| Hardened Scales | 7 | 2.25 |
| Burn | 7 | 2.25 |
| Living End | 6 | 1.93 |
| Jund Saga | 5 | 1.61 |
| Wrenn White Blue | 5 | 1.61 |
| Domain Murktide | 5 | 1.61 |
I wouldn't read too much into the paper data, as again, the tiny dataset exaggerates certain things and minimizes others that probably shouldn't be. However, I do want to address Yawgmoth's position. As far as I could tell, the number of Yawgmoth players hasn't actually changed, as it was showing up in events at a similar pace to what it was pre-ban. I think that the only reason it hit outlier numbers (besides the small sample size) is that everyone else was switching their decks. Yawg players just kept on keeping on.
Also, Burn is falling out of the metagame in both paper and online. While it's tempting to place it on Scion of Draco's combo with Leyline of the Guildpact, it's actually the Leyline itself more than Draco. Yes, a 4/4 untargetable flying lifelinker is bad news. However, that doesn't come up that often compared to just having Leyline and never taking any damage from lands. Players fetching and shocking is really important to Burns plan and with that down, it's much harder for Burn to thrive.
March Power Metagame
Tracking the metagame in terms of population is standard practice. But how do results actually factor in? Better decks should also have better results. In an effort to measure this, I use a power ranking system in addition to the prevalence list. By doing so, I measure the relative strengths of each deck within the metagame so that a deck that just squeaks into Top 32 isn't valued the same as one that Top 8's. This better reflects metagame potential.
For the MTGO data, points are awarded based on the population of the event. Preliminaries award points based on record (1 for 3 wins, 2 for 4 wins, 3 for 5), and Challenges are scored 3 points for the Top 8, 2 for Top 16, and 1 for Top 32. If I can find them, non-Wizards events will be awarded points the same as Challenges or Preliminaries depending on what the event in question reports/behaves like. Super Qualifiers and similar higher-level events get an extra point and so do other events if they’re over 200 players, with a fifth point for going over 400 players.
Due to paper reporting being inconsistent and frequently full of data gaps compared to MTGO, its points work differently. I award points based on the size of the tournament rather than placement. For events with no reported starting population or up to 32 players, one point is awarded to every deck. Events with 33 players up to 128 players get two points. From 129 players up to 512 players get three. Above 512 is four points, and five points will be reserved for Modern Pro Tours.
The MTGO Power Tiers
As with the population numbers, total points are down, from 1908 in February to 1674. The average points were 19.47, therefore 20 points made Tier 3. The STDev was 36.53, so add 37 to the starting point, and Tier 3 runs to 57 points. Tier 2 starts with 58 points and runs to 95. Tier 1 requires at least 96 points. The bottom three decks failed to make the power tier and weren't replaced.
| Deck Name | Total Points | Total # |
|---|---|---|
| Tier 1 | ||
| Yawgmoth | 49 | 9.44 |
| Amulet Titan | 42 | 8.09 |
| Counter Cat | 41 | 7.90 |
| Goryo Blink | 33 | 6.36 |
| Izzet Murktide | 31 | 5.97 |
| Tier 2 | ||
| Coffers | 26 | 5.01 |
| Rakdos Scam | 24 | 4.62 |
| UW Control | 20 | 3.85 |
| Tier 3 | ||
| 4-C Creativity | 18 | 3.47 |
| Hammer Time | 17 | 3.27 |
| Merfolk | 17 | 3.27 |
| MG Tron | 17 | 3.27 |
| Bant Rhinos | 16 | 3.08 |
| Hardened Scales | 16 | 3.08 |
| Burn | 10 | 1.93 |
| Domain Murktide | 9 | 1.73 |
| Jund Creativity | 9 | 1.73 |
| Living End | 8 | 1.54 |
| Jund Saga | 8 | 1.54 |
| Wrenn White Blue | 8 | 1.54 |
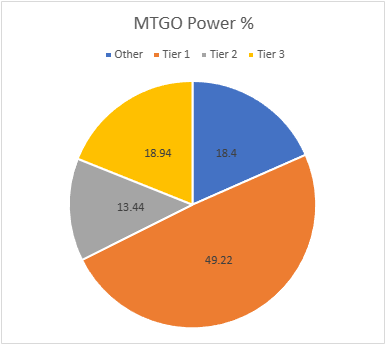
It's weird to see Mono-Green Tron at the top of the tier list. I've got the sneaking suspicion that it got the nod simply because it can maindeck a set of Relic of Progenitus against Goryo Blink and then sweep the board with Oblivion Stone against Leyline decks. With no clear best deck, the online players decided that was good enough and flocked to Tron, which will always be around to do Tron things.
The Paper Power Tiers
Points are massively down from 1653 to 519. The adjusted average points were 7.58, setting the cutoff at 8 points. The STDev was 9.99, thus add 10 to the starting point and Tier 3 runs to 18 points. Tier 2 starts with 19 points and runs to 29. Tier 1 requires at least 30 points. There's a lot of movement in the tiers and Jund Saga joined the power tier.
| Deck Name | Total Points | Total % |
|---|---|---|
| Tier 1 | ||
| Temur Rhinos | 290 | 17.54 |
| Amulet Titan | 131 | 7.92 |
| Living End | 123 | 7.44 |
| Yawgmoth | 114 | 6.70 |
| Rakdos Scam | 92 | 5.57 |
| Izzet Murktide | 74 | 4.48 |
| Tier 2 | ||
| Hammer Time | 65 | 3.93 |
| Counter Cat | 63 | 3.81 |
| Burn | 60 | 3.63 |
| 4-Color Rhinos | 60 | 3.63 |
| 4-Color Control | 59 | 3.57 |
| UW Control | 49 | 2.96 |
| Hardened Scales | 47 | 2.84 |
| Mono-Green Tron | 43 | 2.60 |
| Tier 3 | ||
| 4-Color Creativity | 40 | 2.42 |
| Merfolk | 26 | 1.57 |
| Mill | 23 | 1.39 |
| Coffers | 23 | 1.39 |
| Temur Prowess | 14 | 0.85 |
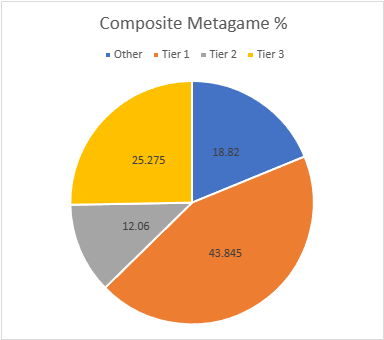
Composite Metagame
That's a lot of data, but what does it all mean? When Modern Nexus was first started, we had a statistical method to combine the MTGO and paper data, but the math of that system doesn't work without big paper events. I tried. Instead, I'm using an averaging system to combine the data. I take the MTGO results and average the tier, then separately average the paper results, then average the paper and MTGO results together for final tier placement.
This generates a lot of partial Tiers. That's not a bug, but a feature. The nuance separates the solidly Tiered decks from the more flexible ones and shows the true relative power differences between the decks. Every deck in the paper and MTGO results is on the table, and when they don't appear in a given category, they're marked N/A. This is treated as a 4 for averaging purposes.
| Deck Name | MTGO Pop Tier | MTGO Power Tier | MTGO Average Tier | Paper Pop Tier | Paper Power Tier | Paper Average Tier | Composite Tier |
|---|---|---|---|---|---|---|---|
| Goryo Blink | 1 | 1 | 1 | 1 | 1 | 1 | 1.00 |
| Yawgmoth | 1 | 1 | 1 | 1 | 1 | 1 | 1.00 |
| Counter Cat | 1 | 1 | 1 | 1 | 1 | 1 | 1.00 |
| Amulet Titan | 1 | 1 | 1 | 1 | 1 | 1 | 1.00 |
| Rakdos Scam | 1 | 1 | 1 | 2 | 2 | 2 | 1.50 |
| Izzet Murktide | 2 | 2 | 2 | 1 | 1 | 1 | 1.50 |
| Mono-Green Tron | 1 | 1 | 1 | 3 | 3 | 3 | 2.00 |
| Domain Murktide | 2 | 2 | 2 | 3 | 3 | 3 | 2.50 |
| Coffers | 3 | 3 | 3 | 2 | 2 | 2 | 2.50 |
| 4-C Creativity | 2 | 3 | 2.5 | 3 | 3 | 3 | 2.75 |
| UW Control | 3 | 3 | 3 | 3 | 2 | 2.5 | 2.75 |
| Bant Rhinos | 3 | 3 | 3 | 3 | 3 | 3 | 3.00 |
| Hardened Scales | 3 | 3 | 3 | 3 | 3 | 3 | 3.00 |
| Living End | 3 | 3 | 3 | 3 | 3 | 3 | 3.00 |
| Wrenn White Blue | 3 | 3 | 3 | 3 | 3 | 3 | 3.00 |
| Hammer Time | 3 | 3 | 3 | 3 | 3 | 3 | 3.00 |
| Rack Scam | 3 | 2 | 2.5 | N/A | N/A | N/A | 3.25 |
| Burn | 3 | N/A | 3.5 | 3 | 3 | 3 | 3.25 |
| Mill | 3 | 3 | 3 | N/A | N/A | N/A | 3.50 |
| Merfolk | N/A | N/A | N/A | 3 | 3 | 3 | 3.50 |
| Jund Saga | N/A | N/A | N/A | 3 | 3 | 3 | 3.50 |
| Wishshift | 3 | N/A | 3.5 | N/A | N/A | N/A | 3.75 |
| Domain Zoo | 3 | N/A | 3.5 | N/A | N/A | N/A | 3.75 |
| Jund Creativity | N/A | N/A | N/A | N/A | 3 | 3.5 | 3.75 |
Average Power Rankings
Finally, we come to the average power rankings. These are found by taking the total points earned and dividing them by total decks, to measure points per deck. I use this to measure strength vs. popularity. Measuring deck strength is hard. There is no Wins-Above-Replacement metric for Magic, and I'm not certain that one could be credibly devised. The game is too complex, and even then, power is very contextual.
Using the power rankings certainly helps and serves to show how justified a deck’s popularity is. However, more popular decks will still necessarily earn a lot of points. Therefore, the top tier doesn't move much between population and power and obscures whether its decks really earned their position.
This is where the averaging comes in. Decks that earn a lot of points because they get a lot of results will do worse than decks that win more events, indicating which deck actually performs better.
A higher average indicates lots of high finishes, whereas low averages result from mediocre performances and a high population. Lower-tier decks typically do very well here, likely due to their pilots being enthusiasts. Bear this in mind and be careful about reading too much into these results. However, as a general rule, decks that place above the baseline average are over-performing, and vice versa.
How far above or below that average a deck sits justifies its position on the power tiers. Decks well above baseline are undervalued, while decks well below baseline are very popular, but aren't necessarily good.
The Real Story
When considering the average points, the key is looking at how far off a deck is from the Baseline stat (the overall average of points/population). The closer a deck’s performance to the Baseline, the more likely it is to be performing close to its "true" potential.
A deck that is exactly average would therefore perform exactly as well as expected. The greater the deviation from the average, the more a deck under or over-performs. On the low end, a deck’s placing was mainly due to population rather than power, which suggests it’s overrated. A high-scoring deck is the opposite of this.
I'll begin with the averages for MTGO:
| Deck Name | Average Points | Power Tier |
|---|---|---|
| UW Control | 1.82 | 3 |
| Rack Scam | 1.79 | 2 |
| Hardened Scales | 1.77 | 3 |
| Amulet Titan | 1.72 | 1 |
| Domain Murktide | 1.70 | 2 |
| Counter Cat | 1.67 | 1 |
| Wrenn White Blue | 1.67 | 3 |
| Baseline | 1.66 | |
| Izzet Murktide | 1.65 | 2 |
| Hammer Time | 1.64 | 3 |
| MG Tron | 1.63 | 1 |
| Living End | 1.63 | 3 |
| 4-C Creativity | 1.58 | 3 |
| Yawgmoth | 1.56 | 1 |
| Rakdos Scam | 1.52 | 1 |
| Goryo Blink | 1.47 | 1 |
| Mill | 1.44 | 3 |
| Bant Rhinos | 1.44 | 3 |
| Coffers | 1.38 | 3 |
Amulet Titan is MTGO's Deck of the Month. Not that there was much competition. This is the worst overall performance by Tier 1 decks on the average power tier ever.
Now the paper averages:
| Deck Name | Average Power | Power Tier |
|---|---|---|
| Hardened Scales | 2.29 | 3 |
| Jund Creativity | 2.25 | 3 |
| Coffers | 2.17 | 2 |
| Merfolk | 1.89 | 3 |
| MG Tron | 1.89 | 3 |
| UW Control | 1.82 | 2 |
| Domain Murktide | 1.80 | 3 |
| Counter Cat | 1.78 | 1 |
| Bant Rhinos | 1.78 | 3 |
| Rakdos Scam | 1.71 | 2 |
| Hammer Time | 1.70 | 3 |
| Amulet Titan | 1.68 | 1 |
| Goryo Blink | 1.65 | 1 |
| 4-C Creativity | 1.64 | 3 |
| Izzet Murktide | 1.63 | 1 |
| Jund Saga | 1.60 | 3 |
| Wrenn White Blue | 1.60 | 3 |
| Baseline | 1.55 | |
| Yawgmoth | 1.48 | 1 |
| Burn | 1.43 | 3 |
| Living End | 1.33 | 3 |
Meanwhile, Counter Cat takes home the crown for paper. Though again, not a great overall showing for the Tier 1 decks, with Yawgmoth in a similar position to Blink from MTGO.
Analysis
While the Outburst ban has not outright killed either Rhinos or Living End, they are both clearly struggling. I suspect, but can't prove, that this is mostly a perception problem. Moving Rhinos in a more controlling direction by going Bant has been a solid move as far I as I can tell, and while the deck has lost a step it's still quite powerful. I think that the difference in power from Violent Outburst to Ardent Plea turned a lot of players off the deck, thinking it unplayable when that really isn't the case.
Living End is having a harder time. It can't use Plea as easily and maintain any kind of mana stability. I've seen a lot of different versions so far, and they've all clearly lost a step. However, there's also a lot of interesting brewing happening. Some have moved in a controlling direction and some are going for broken with Bloodbraid Marauder. There's still a lot of power in the suspend cards, so I think those declaring either deck dead will be disproven.
The Guildpact's World
The fear in the wake of the ban was that Leyline/Draco would be everywhere and take over Modern. The former fear was realized, but the latter has been frustrated. While I have seen those cards and often Leyline Binding in every conceivable deck, just because those 12 cards can go anywhere doesn't mean that they should. The only Leyline/Draco deck that are really thriving are Counter Cat and Domain Murktide. Everything else only shows up in very small numbers, and don't do too well.
The simple fact is that while the combo is quite powerful, it's also quite unlikely. The odds of having both in the opening hand is just under 20%, with the odds of having both out before turn 4 being about 25%. If that doesn't happen, there has to be some justification for having the constituent cards in the deck and outside of decks that were already 4+ color creature decks, there's negligible benefit to either card. I'd consequently expect to see the Domain players giving up on the random decks and converging on either Murktide or Cat builds.
Financial Implications
With Modern Horizons 3 approaching, most players are playing it safe on the financial side. The (perfectly fair) expectation is that Modern's going to have another earthshaking upheaval. Thus, they don't want to speculate on buying a new deck when it may just be invalidated in a few months. Thus, the overall demand in the market is down.
Staple prices remain stable, and the price spikes from the ban have cooled but not disappeared. I expect this to be the norm for the next few months. Thus, my advice is to avoid speculation and simply circle the financial wagons and wait to see what's coming down the pipe. Given what I've seen from Outlaws of Thunder Junction, there's not much to worry about.

The ban looks like it’s having the effect of pushing players into trying other decks and exploring new strategies. At least momentarily. It seems like a diverse enough metagame. Interesting time to play Modern.