Are you a Quiet Speculation member?
If not, now is a perfect time to join up! Our powerful tools, breaking-news analysis, and exclusive Discord channel will make sure you stay up to date and ahead of the curve.
April was a weird month for Modern. On the one hand, it remains the most popular competitive format on Magic Online (MTGO) by a very wide margin. On the other hand, it's Pioneer RCQ season and most of the paper attention is away. The data reflects this dichotomy, as the online results are far greater than paper. However, as always, one needs to take the online results with a grain of salt. There are only a few thousand total players, and the events are dominated by a very small number of players. Their results are therefore heavily affected by groupthink.
Outliers Return
The March ban and the ensuing chaos and uncertainty prevented MTGO from having any outliers. Now that the chaos has largely subsided, the outliers are back in force with the top four decks being clear outliers. When you see the data, it won't be very surprising. Per my longstanding policy, outliers are removed from the data analysis but reported in their correct position on the Tier List. I almost wish this wasn't the case, as when you include the MTGO outliers the data looks more even and normalized.
As for the paper results, I've removed Yawgmoth as an outlier, but this one is less clear. I run a number of different outlier tests on the data and remove the ones the majority agree on. Normally the tests are quite clear and completely agree with each other. This time, none of them agreed. I could have removed between 0 and 4 decks, depending on the test. As Yawgmoth was the only one that the tests that identified as outliers agreed on, I removed it. However, this data set is clearly a weird one.
March Population Metagame
To make the tier list, a given deck has to beat the overall average population for the month. The average is my estimate for how many results a given deck "should" produce in a given month. Being a tiered deck requires being better than "good enough". Every deck that posts at least the average number of results is "good enough" and makes the tier list.
Then we go one standard deviation (STdev) above average to set the limit of Tier 3 and the cutoff for Tier 2. This mathematically defines Tier 3 as those decks clustered near the average. Tier 2 goes from the cutoff to the next standard deviation. These are decks that perform well above average. Tier 1 consists of those decks at least two standard deviations above the mean result, encompassing the truly exceptional performing decks.
The MTGO data nearly exclusively comes from official Preliminary and Challenge results. Leagues are excluded, as they add analytically useless bulk data to both the population and power tiers. The paper data comes from any source I can find, with all reported events being counted.
While the MTGO events report predictable numbers, paper events can report anything from only the winner to all the results. In the latter case, if match results aren't included, I'll take as much of the Top 32 as possible. If match results are reported, I'll take winning record up to Top 32, and then any additional decks tied with 32nd place, as tiebreakers are a magic most foul and black.
A Note on the Data
Daybreak is now releasing the total results from every MTGO Preliminary, Challenge, and League 5-0. After some experimentation, I'm sticking to just using the Challenge Top 32 results and 3-1 or better from the Preliminaries. The first reason is that, ultimately, nothing changed. The population metagame list didn't change between my normal method and the experimental versions. Various treatments for the power metagame did change the order of the tier list, but the composition varied only marginally.
The second reason was that dealing with all that data is significantly more work, even with automation. I'm not a great programmer but setting up and training the bots and then auditing the results took significantly longer than my current system, and I'd have to redo it monthly. Since it made little difference, I'm not going to make more work for myself. There are other sites that put together winrates with all the new data anyway, so I don't feel that anything's being lost. It also means that comparing the paper to MTGO results is easier.
The MTGO Population Data
March's adjusted average population for MTGO was 10.43, setting the Tier 3 cutoff at 12 decks. I always round down if the decimal is less than .20. Tier 3, therefore, begins with decks posting 11 results. The STdev was 18.04, so add 18 and that means Tier 3 runs to 29 results. Again, it's the starting point to the cutoff, then the next whole number for the next Tier. Therefore Tier 2 starts with 30 results and runs to 48. Subsequently, to make Tier 1, 49 decks are required.
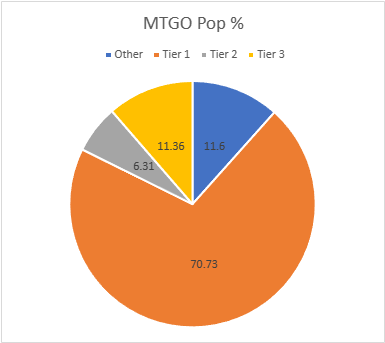
April is the largest MTGO sample this year. January had 1,400 decks, February was 1225, March hit 1042, but April is a whopping 1664. Daybreak continues to add events, so the numbers continue to rise. I'm now taking bets on when MTGO's sample size hits 2,000.
However, that high sample size did not translate to real diversity. The total number of decks in my data set is up from 86 to 103, but the unique deck ratio fell from .082 to .062. The number of decks is therefore relatively down compared to March. 26 decks made the Tier List up from 21 in March, which again isn't a great increase given the higher overall population.
| Deck Name | Total # | Total % |
|---|---|---|
| Tier 1 | ||
| Rakdos Scam | 218 | 13.10 |
| Counter Cat | 171 | 10.28 |
| Yawgmoth | 144 | 8.65 |
| Amulet Titan | 140 | 8.41 |
| Living End | 87 | 5.23 |
| Mono-Green Tron | 74 | 4.45 |
| 4-Color Creativity | 68 | 4.09 |
| Izzet Prowess | 60 | 3.61 |
| Izzet Murktide | 57 | 3.43 |
| Jund Creativity | 54 | 3.25 |
| Coffers | 53 | 3.19 |
| Goryo Blink | 51 | 3.06 |
| Tier 2 | ||
| UW Control | 40 | 2.40 |
| Rack Scam | 34 | 2.04 |
| Domain Zoo | 31 | 1.86 |
| Tier 3 | ||
| Bant Rhinos | 26 | 1.56 |
| Temur Prowess | 24 | 1.44 |
| Hardened Scales | 21 | 1.26 |
| Wrenn White Blue | 19 | 1.14 |
| Domain Murktide | 18 | 1.08 |
| Mono-White Emeria | 18 | 1.08 |
| Mill | 17 | 1.02 |
| Wishshift | 12 | 0.72 |
| Jund Saga | 12 | 0.72 |
| UW Urzablade | 11 | 0.66 |
| Affinity | 11 | 0.66 |
If I was as lazy as the other sites and lumped together Counter Cat, Domain Murktide, Domain Zoo, and everything else under the Domain Zoo banner, then that deck would be #1 by quite a large margin. Despite keeping the Murktide and Counter Cat categories separate, there were so many hard to classify similar decks that I gave up and dumped them in Domain Zoo this month. Despite this, Counter Cat remains the most popular variant by far, and many players seem to be abandoning the Murktide variant for Counter Cat, as I predicted in March.
Rakdos Scam regained the top spot on MTGO, though I think that's a fluke. The pattern I saw for MTGO was players falling back on their old warhorses, as witnessed by the return of Creativity decks. MTGO's spikes don't have a clear Best Deck anymore, so they're seeking familiarity. We'll see if this lasts until Modern Horizons 3.
The Paper Population Data
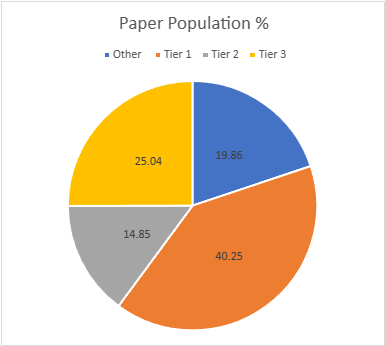
Paper's dataset is recovering but is still down. January had 803 decks, February 890, March had 311, and April is up to 559. The real diversity is also solid, though because of the weirdness of March it looks bad. March had 63 unique decks and a ratio of .203 while April has 88 and .16. This doesn't represent an actual fall in diversity since March's numbers were a reflection of low population.
Tiered decks rose from 17 to 24, which is where I'd expect a healthy metagame of this size to be. The adjusted average population was 5.84, so 6 results make the list. The adjusted STDev was 9.75, so the increment is 10. Therefore, Tier 3 runs from 6 to 16, Tier 2 is 17 to 27, and Tier 1 is 28 and over.
| Deck Name | Total # | Total % |
|---|---|---|
| Tier 1 | ||
| Yawgmoth | 51 | 9.12 |
| Amulet Titan | 49 | 8.77 |
| Counter Cat | 47 | 8.41 |
| Rakdos Scam | 46 | 8.23 |
| Goryo Blink | 32 | 5.72 |
| Tier 2 | ||
| 4-Color Creativity | 24 | 4.29 |
| Izzet Murktide | 22 | 3.94 |
| UW Control | 19 | 3.40 |
| Coffers | 18 | 3.22 |
| Tier 3 | ||
| Hammer Time | 13 | 2.32 |
| Jund Creativity | 13 | 2.32 |
| Mono-Green Tron | 12 | 2.15 |
| Mono-White Emeria | 11 | 1.97 |
| Living End | 11 | 1.97 |
| Bant Rhinos | 10 | 1.79 |
| Hardened Scales | 10 | 1.79 |
| Domain Zoo | 9 | 1.61 |
| Wrenn White Blue | 9 | 1.61 |
| Izzet Prowess | 9 | 1.61 |
| Burn | 8 | 1.43 |
| Domain Murktide | 7 | 1.25 |
| Bring to Light | 6 | 1.07 |
| Mono-Black Scam | 6 | 1.07 |
| 4-Color Control | 6 | 1.07 |
I didn't expect the outlier tests to have any outliers pop out. However, only one had no outliers. Stats can be wild, yo. Goryo Blink is rapidly falling from Tier 1 in both play mediums and I expect that to continue. Its most powerful plan is easy prey for graveyard hate and the Ephemerate elementals plan isn't enough to carry a deck. Bant Blink and/or Griefblade would have been top tier decks by now if it were.
March Power Metagame
Tracking the metagame in terms of population is standard practice. But how do results actually factor in? Better decks should also have better results. In an effort to measure this, I use a power ranking system in addition to the prevalence list. By doing so, I measure the relative strengths of each deck within the metagame so that a deck that just squeaks into Top 32 isn't valued the same as one that Top 8's. This better reflects metagame potential.
For the MTGO data, points are awarded based on the population of the event. Preliminaries award points based on record (1 for 3 wins, 2 for 4 wins, 3 for 5), and Challenges are scored 3 points for the Top 8, 2 for Top 16, and 1 for Top 32. If I can find them, non-Wizards events will be awarded points the same as Challenges or Preliminaries depending on what the event in question reports/behaves like. Super Qualifiers and similar higher-level events get an extra point and so do other events if they’re over 200 players, with a fifth point for going over 400 players.
Due to paper reporting being inconsistent and frequently full of data gaps compared to MTGO, its points work differently. I award points based on the size of the tournament rather than placement. For events with no reported starting population or up to 32 players, one point is awarded to every deck. Events with 33 players up to 128 players get two points. From 129 players up to 512 players get three. Above 512 is four points, and five points will be reserved for Modern Pro Tours.
The MTGO Power Tiers
As with the population numbers, total points are up, from 1674 in March to 2770. The adjusted average points were 17.05, therefore 17 points made Tier 3. The STDev was 29.80, so add 30 to the starting point, and Tier 3 runs to 47 points. Tier 2 starts with 48 points and runs to 78. Tier 1 requires at least 79 points. Jund Saga failed to make the power tier and wasn't replaced.
| Deck Name | Total Points | Total % |
|---|---|---|
| Tier 1 | ||
| Rakdos Scam | 382 | 13.79 |
| Counter Cat | 276 | 9.96 |
| Yawgmoth | 254 | 9.17 |
| Amulet Titan | 235 | 8.48 |
| Living End | 147 | 5.31 |
| Mono-Green Tron | 114 | 4.12 |
| Izzet Prowess | 105 | 3.79 |
| 4-Color Creativity | 103 | 3.72 |
| Izzet Murktide | 98 | 3.54 |
| Coffers | 90 | 3.25 |
| Goryo Blink | 85 | 3.07 |
| Jund Creativity | 84 | 3.03 |
| Tier 2 | ||
| UW Control | 65 | 2.35 |
| Rack Scam | 59 | 2.13 |
| Domain Zoo | 54 | 1.95 |
| Tier 3 | ||
| Temur Prowess | 45 | 1.62 |
| Bant Rhinos | 44 | 1.59 |
| Hardened Scales | 34 | 1.23 |
| Domain Murktide | 31 | 1.12 |
| Wrenn White Blue | 30 | 1.08 |
| Mono-White Emeria | 27 | 0.97 |
| Mill | 27 | 0.97 |
| Wishshift | 25 | 0.90 |
| UW Urzablade | 21 | 0.76 |
| Affinity | 18 | 0.65 |
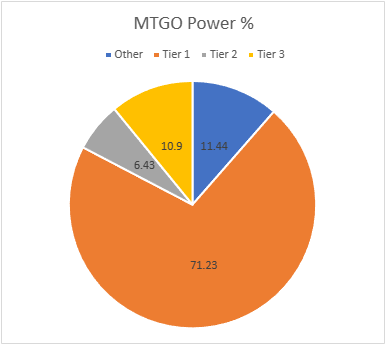
There's a lot of movement inside the tiers but no movement between them. Given the huge gaps that's not surprising. I've noticed that big gaps are quite common on MTGO but not so much in paper. While the usual suspects of groupthink and small playerbase could be the entire problem, I do wonder how much to blame the rental services. Players get a deck for a month and play them constantly, far more than you usually see in paper. I wonder how much they're locked into their deck for the whole month and if that is a reason you see huge swings and gaps all the time in the MTGO data.
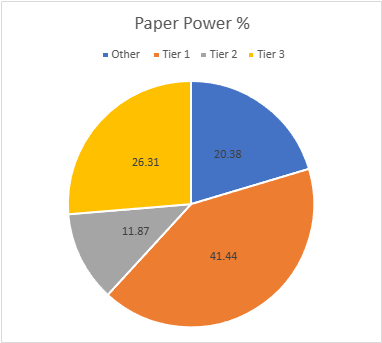
The Paper Power Tiers
Points are massively up from 519 to 1163. There were a lot of 3-point events in April. The adjusted average points were 12.23, setting the cutoff at 13 points. The STDev was 21.14, thus add 21 to the starting point and Tier 3 runs to 34 points. Tier 2 starts with 35 points and runs to 56. Tier 1 requires at least 57 points. There's a lot of movement in the tiers, while Bring to Light and 4-Color Control fell off the list.
| Deck Name | Total Points | Total % |
|---|---|---|
| Tier 1 | ||
| Amulet Titan | 109 | 9.37 |
| Yawgmoth | 108 | 9.29 |
| Counter Cat | 107 | 9.20 |
| Rakdos Scam | 95 | 8.17 |
| Goryo Blink | 63 | 5.42 |
| Tier 2 | ||
| 4-Color Creativity | 53 | 4.56 |
| Izzet Murktide | 47 | 4.04 |
| UW Control | 38 | 3.27 |
| Tier 3 | ||
| Coffers | 32 | 2.75 |
| Jund Creativity | 31 | 2.67 |
| Hammer Time | 30 | 2.58 |
| Mono-White Emeria | 23 | 1.98 |
| Domain Zoo | 23 | 1.98 |
| Hardened Scales | 22 | 1.89 |
| Izzet Prowess | 22 | 1.89 |
| Wrenn White Blue | 22 | 1.89 |
| Living End | 20 | 1.72 |
| Bant Rhinos | 20 | 1.72 |
| Mono-Green Tron | 16 | 1.38 |
| Burn | 16 | 1.38 |
| Mono-Black Scam | 15 | 1.29 |
| Domain Murktide | 14 | 1.20 |
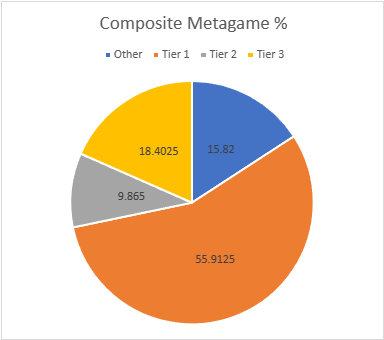
Composite Metagame
That's a lot of data, but what does it all mean? When Modern Nexus was first started, we had a statistical method to combine the MTGO and paper data, but the math of that system doesn't work without big paper events. I tried. Instead, I'm using an averaging system to combine the data. I take the MTGO results and average the tier, then separately average the paper results, then average the paper and MTGO results together for final tier placement.
This generates a lot of partial Tiers. That's not a bug, but a feature. The nuance separates the solidly Tiered decks from the more flexible ones and shows the true relative power differences between the decks. Every deck in the paper and MTGO results is on the table, and when they don't appear in a given category, they're marked N/A. This is treated as a 4 for averaging purposes.
| Deck Name | MTGO Pop Tier | MTGO Power Tier | MTGO Average Tier | Paper Pop Tier | Paper Power Tier | Paper Average Tier | Composite Tier |
|---|---|---|---|---|---|---|---|
| Rakdos Scam | 1 | 1 | 1 | 1 | 1 | 1 | 1.00 |
| Counter Cat | 1 | 1 | 1 | 1 | 1 | 1 | 1.00 |
| Yawgmoth | 1 | 1 | 1 | 1 | 1 | 1 | 1.00 |
| Amulet Titan | 1 | 1 | 1 | 1 | 1 | 1 | 1.00 |
| Goryo Blink | 1 | 1 | 1 | 1 | 1 | 1 | 1.00 |
| 4-Color Creativity | 1 | 1 | 1 | 2 | 2 | 2 | 1.50 |
| Izzet Murktide | 1 | 1 | 1 | 2 | 2 | 2 | 1.50 |
| Coffers | 1 | 1 | 1 | 2 | 3 | 2.5 | 1.75 |
| Living End | 1 | 1 | 1 | 3 | 3 | 3 | 2.00 |
| Mono-Green Tron | 1 | 1 | 1 | 3 | 3 | 3 | 2.00 |
| Izzet Prowess | 1 | 1 | 1 | 3 | 3 | 3 | 2.00 |
| Jund Creativity | 1 | 1 | 1 | 3 | 3 | 3 | 2.00 |
| UW Control | 2 | 2 | 2 | 2 | 2 | 2 | 2.00 |
| Domain Zoo | 2 | 2 | 2 | 3 | 3 | 3 | 2.50 |
| Rack Scam | 2 | 2 | 2 | N/A | N/A | N/A | 3.00 |
| Bant Rhinos | 3 | 3 | 3 | 3 | 3 | 3 | 3.00 |
| Hardened Scales | 3 | 3 | 3 | 3 | 3 | 3 | 3.00 |
| Wrenn White Blue | 3 | 3 | 3 | 3 | 3 | 3 | 3.00 |
| Domain Murktide | 3 | 3 | 3 | 3 | 3 | 3 | 3.00 |
| Mono-White Emeria | 3 | 3 | 3 | 3 | 3 | 3 | 3.00 |
| Temur Prowess | 3 | 3 | 3 | N/A | N/A | N/A | 3.50 |
| Mill | 3 | 3 | 3 | N/A | N/A | N/A | 3.50 |
| Wishshift | 3 | 3 | 3 | N/A | N/A | N/A | 3.50 |
| UW Urzablade | 3 | 3 | 3 | N/A | N/A | N/A | 3.50 |
| Affinity | 3 | 3 | 3 | N/A | N/A | N/A | 3.50 |
| Hammer Time | N/A | N/A | N/A | 3 | 3 | 3 | 3.50 |
| Burn | N/A | N/A | N/A | 3 | 3 | 3 | 3.50 |
| Bring to Light | N/A | N/A | N/A | 3 | 3 | 3 | 3.50 |
| Jund Saga | 3 | N/A | 3.5 | N/A | N/A | N/A | 3.75 |
| Mono-Black Scam | N/A | N/A | N/A | 3 | N/A | 3.5 | 3.75 |
| 4-Color Control | N/A | N/A | N/A | 3 | N/A | 3.5 | 3.75 |
Average Power Rankings
Finally, we come to the average power rankings. These are found by taking the total points earned and dividing them by total decks, to measure points per deck. I use this to measure strength vs. popularity. Measuring deck strength is hard. There is no Wins-Above-Replacement metric for Magic, and I'm not certain that one could be credibly devised. The game is too complex, and even then, power is very contextual.
Using the power rankings certainly helps and serves to show how justified a deck’s popularity is. However, more popular decks will still necessarily earn a lot of points. Therefore, the top tier doesn't move much between population and power and obscures whether its decks really earned their position.
This is where the averaging comes in. Decks that earn a lot of points because they get a lot of results will do worse than decks that win more events, indicating which deck actually performs better.
A higher average indicates lots of high finishes, whereas low averages result from mediocre performances and a high population. Lower-tier decks typically do very well here, likely due to their pilots being enthusiasts. Bear this in mind and be careful about reading too much into these results. However, as a general rule, decks that place above the baseline average are over-performing, and vice versa.
How far above or below that average a deck sits justifies its position on the power tiers. Decks well above baseline are undervalued, while decks well below baseline are very popular, but aren't necessarily good.
The Real Story
When considering the average points, the key is looking at how far off a deck is from the Baseline stat (the overall average of points/population). The closer a deck’s performance to the Baseline, the more likely it is to be performing close to its "true" potential.
A deck that is exactly average would therefore perform exactly as well as expected. The greater the deviation from the average, the more a deck under or over-performs. On the low end, a deck’s placing was mainly due to population rather than power, which suggests it’s overrated. A high-scoring deck is the opposite of this.
I'll begin with the averages for MTGO:
| Deck Name | Total Points | Power Tier |
|---|---|---|
| Wishshift | 2.08 | 3 |
| UW Urzablade | 1.91 | 3 |
| Temur Prowess | 1.88 | 3 |
| Yawgmoth | 1.76 | 1 |
| Rakdos Scam | 1.75 | 1 |
| Izzet Prowess | 1.75 | 1 |
| Domain Zoo | 1.74 | 2 |
| Rack Scam | 1.73 | 2 |
| Izzet Murktide | 1.72 | 1 |
| Domain Murktide | 1.72 | 3 |
| Coffers | 1.70 | 1 |
| Living End | 1.69 | 1 |
| Bant Rhinos | 1.69 | 3 |
| Amulet Titan | 1.68 | 1 |
| Goryo Blink | 1.67 | 1 |
| Affinity | 1.63 | 3 |
| UW Control | 1.62 | 2 |
| Hardened Scales | 1.62 | 3 |
| Counter Cat | 1.61 | 1 |
| Mill | 1.59 | 3 |
| Wrenn White Blue | 1.58 | 3 |
| Jund Creativity | 1.56 | 1 |
| Mono-Green Tron | 1.54 | 1 |
| Baseline | 1.54 | |
| 4-Color Creativity | 1.51 | 1 |
| Mono-White Emeria | 1.50 | 3 |
| Jund Saga | 1.33 | N/A |
Yawgmoth just barely beats Scam to be April's MTGO Deck of the Month.
Now the paper averages:
| Deck Name | Average Points | Power Tier |
|---|---|---|
| Domain Zoo | 2.56 | 3 |
| Mono-Black Scam | 2.50 | 3 |
| Izzet Prowess | 2.44 | 3 |
| Wrenn White Blue | 2.44 | 3 |
| Jund Creativity | 2.38 | 3 |
| Hammer Time | 2.31 | 3 |
| Counter Cat | 2.28 | 1 |
| Amulet Titan | 2.22 | 1 |
| 4-Color Creativity | 2.21 | 2 |
| Hardened Scales | 2.20 | 3 |
| Izzet Murktide | 2.14 | 2 |
| Yawgmoth | 2.12 | 1 |
| Mono-White Emeria | 2.09 | 3 |
| Rakdos Scam | 2.06 | 1 |
| UW Control | 2.00 | 2 |
| Bant Rhinos | 2.00 | 3 |
| Burn | 2.00 | 3 |
| Domain Murktide | 2.00 | 3 |
| Goryo Blink | 1.97 | 1 |
| Baseline | 1.97 | |
| Bring to Light | 1.83 | N/A |
| Living End | 1.82 | 3 |
| Coffers | 1.78 | 3 |
| 4-Color Control | 1.50 | N/A |
| Mono-Green Tron | 1.33 | 3 |
Counter Cat takes home the crown for paper for the second month running. I thought that was a Living End thing, but here we are.
Analysis
April's metagame appears to me to be a holding pattern. MTGO moved back to old favorites while with less competitive pressure, players in paper branched out and were more experimental. This is no bad thing. However, it does mean that the utility of this data is a bit limited. The bottom line is that Modern is on hold until MH3 comes out, and so I expect metagame stagnation until then.
The most significant development is the return of Prowess to prominence. Slickshot Show-Off drove a lot of players back to the deck and is probably behind the fall-off in Izzet Murktide numbers. There were a number of variants, but Izzet Prowess outperformed them by a wide margin. Ignore how Goldfish lists the deck, a sideboard card and Jegantha, the Wellspring don't count as a color identity.
I wouldn't expect Prowess to gain the place it held prior to MH2. All the new removal that was responsible for its downfall then is still around, and once players adjust to the deck's new playstyle it will lose some ground. However, the deck's best plot turns are sufficiently broken that I don't think it will be a flash in the pan, though again we'll have to wait and see what MH3 does.
The Leaks
On that note, Wizards had to acknowledge a number of MH3 leaks recently. There's been a ton of speculation already, but it's important to temper expectations. We've only seen about two dozen confirmed cards, and there's plenty of room for something far more interesting to drop. That said, we have confirmation of a strong Eldrazi and artifact theme in the set. This will cause a major shakeup and a lot of brewing to happen, which is why current Modern players are apparently twiddling their thumbs.
Financial Considerations
Obviously, any Modern finance decisions must be made with an eye towards MH3. The aren't a lot of opportunities in taking advantage of the current metagame. With Kappa Cannoneer confirmed, players are understandably focused on Affinity-type decks. Thus, any staple for that deck is a good speculative buy before the big rush around MH3's release. However, I would also make sure to stock Shatterstorm and Kataki, War's Wage as they're the best counters to that theoretical deck.
The other big opportunity is Isochron Scepter. Orim's Chant was its best friend back in Extended and is coming to Modern in MH3. With the band back together, old-timers will be wanting to relive the glory days. I don't think it will work out well for them, as there are more answers now than in the bygone days. However, it will certainly be a sought-after card in the near future. Pick up some while the price is stable and be ready to move them quickly. I think the bubble on Scepter will burst quickly post release.
