Are you a Quiet Speculation member?
If not, now is a perfect time to join up! Our powerful tools, breaking-news analysis, and exclusive Discord channel will make sure you stay up to date and ahead of the curve.
I'm not the type to bury the lede. Modern's metagame picture got worse in October. How much worse depends on the specific play-medium and perspective, but the data has a very clear story that a lot of players are not going to like. One that I don't expect is going to get better in November.
Went Without Saying
Rakdos Scam is a massive outlier. Again. To the point that, just like in September, the only reason to do any statistical tests was due diligence for any other anomalies. There were none. I don't think there's enough free space left for anyone to rise high enough to become an outlier at this point. Scam's that big.
As always, outliers are reported in their correct place on the metagame charts but were not included in the statistical analysis.
October Population Metagame
To make the tier list, a given deck has to beat the overall average population for the month. The average is my estimate for how many results a given deck "should" produce in a given month. Being a tiered deck requires being better than "good enough". Every deck that posts at least the average number of results is "good enough" and makes the tier list.

Then we go one standard deviation (STdev) above average to set the limit of Tier 3 and the cutoff for Tier 2. This mathematically defines Tier 3 as those decks clustered near the average. Tier 2 goes from the cutoff to the next standard deviation. These are decks that perform well above average. Tier 1 consists of those decks at least two standard deviations above the mean result, encompassing the truly exceptional performing decks.
The MTGO data nearly exclusively comes from official Preliminary and Challenge results. Leagues are excluded, as they are curated lists and thus invalid. The paper data comes from any source I can find, with all reported events being counted.
While the MTGO events report predictable numbers, paper events can report anything from only the winner to all the results. In the latter case, if match results aren't included, I'll take as much of the Top 32 as possible. If match results are reported, I'll take winning record up to Top 32, and then any additional decks tied with 32nd place, as tiebreakers are a magic most foul and black.
The MTGO Population Data
October's adjusted average population for MTGO was 9.08, setting the Tier 3 cutoff at 9 decks. I always round down if the decimal is less than .20. Tier 3, therefore, begins with decks posting 10 results. The adjusted STdev was 14.04, so add 14 and that means Tier 3 runs to 23 results. Again, it's the starting point to the cutoff, then the next whole number for the next Tier. Therefore Tier 2 starts with 24 results and runs to 38. Subsequently, to make Tier 1, 39 decks are required.

Data was up significantly across the board in October. January 2023 had 840 decks, February had 876, and March had a staggering 1,003 decks. April fell to 949 decks, May plummeted to 770 decks, and June surged to 918, while July topped out at 1086, August fell to 724 decks, and September hit 837 decks. October is up to 935. Whatever else can be said, Daybreak is quite good at keeping players on MTGO.
A higher population did yield more unique decks, but not by much. January had 74 unique decks, February had 84, and March mustered 88. April, May, June had 82 decks, July had 87 decks, August crashed to 71, and September was up to 75. Despite having almost 100 more decks, October only had three more decks at 78. I'm not surprised given the table directly below this sentence.
| Deck Name | Total # | Total % |
|---|---|---|
| Tier 1 | ||
| Rakdos Scam | 236 | 25.24 |
| Yawgmoth | 65 | 6.95 |
| Amulet Titan | 45 | 4.81 |
| Burn | 45 | 4.81 |
| Mono-Green Tron | 43 | 4.60 |
| 4-Color Control | 41 | 4.39 |
| Tier 2 | ||
| Hardened Scales | 38 | 4.06 |
| Coffers | 37 | 3.96 |
| 4-Color Bean Cascade | 36 | 3.85 |
| Living End | 35 | 3.74 |
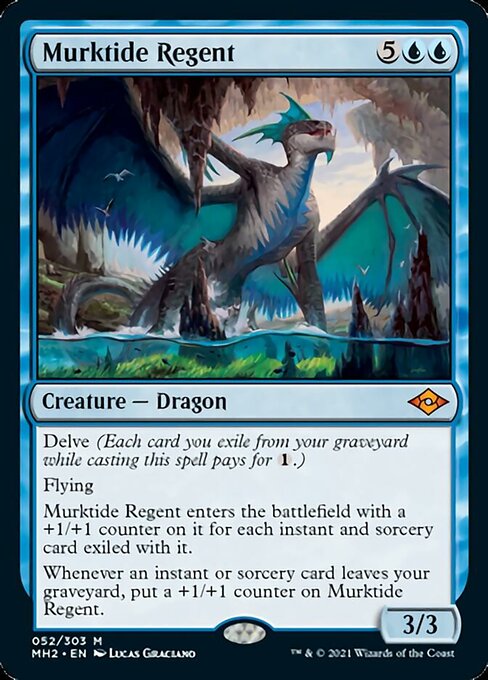
| UR Murktide | 30 | 3.21 |
| Temur Rhinos | 29 | 3.10 |
| Hammer Time | 26 | 2.78 |
| Tier 3 | ||
| Counter Cat | 18 | 1.92 |
| Bring to Light | 16 | 1.71 |
| 4-Color Bean Scam | 14 | 1.50 |
| UW Control | 13 | 1.39 |
| UB Murktide | 10 | 1.07 |
| Temur Druid | 10 | 1.07 |
| Wishshift | 10 | 1.07 |
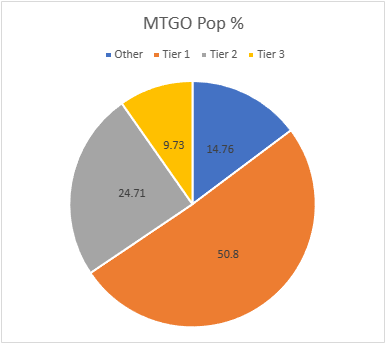
Scam's metagame share is the largest I've ever recorded in these metagame updates. I wasn't doing this type of data during Hogaak, Arisen Necropolis' reign, and I didn't do the updates during Eldrazi Winter. Worth noting that we called Eldrazi Tier 0 and it held 35% of the metagame. The total percentage is pretty bad, but that enormity of the gap makes it much worse. I checked; UR Murktide never pulled this far away during its run.
The Paper Population Data
Paper's population is also up considerably. January saw 667 decks, February up to 807, March hit 962, April plunged to 551, May was up to 581, June was down 547, July surged to 671 decks, and August fell to 558, September shot up to 775 decks. Thanks to a lot more RCQ's happening, paper's data skyrocketed to 1,102 decks, the highest I've ever had. Tons of smaller events do that, though it makes gathering the data quite annoying.
Unlike the online data, paper's higher population did translate into more unique decks. A lot more. January had 101 decks, February 108, March just 103, April down to 89, May was up to 102, June and July sat at 79, August made 77, and September hit 82. October is up to 109, the most unique decks ever. That didn't translate into significantly more decks on the tier list, which is just 22 up from 19. That's not a great sign. The adjusted average population was 9.28, so 10 results make the list. The adjusted STDev was 16.45, so the increment is 17. Therefore, Tier 3 runs from 10 to 27, Tier 2 is 28 to 45, and Tier 1 is 46 and over.
| Deck Name | Total # | Total % |
|---|---|---|
| Tier 1 | ||
| Rakdos Scam | 192 | 17.42 |
| Temur Rhinos | 71 | 6.44 |
| Amulet Titan | 63 | 5.72 |
| Yawgmoth | 62 | 5.63 |
| UR Murktide | 57 | 5.17 |
| Mono-Green Tron | 55 | 4.99 |
| Burn | 51 | 4.63 |
| Hammer Time | 49 | 4.45 |
| 4-Color Control | 48 | 4.36 |
| Hardened Scales | 47 | 4.26 |
| Tier 2 | ||
| Coffers | 39 | 3.54 |
| Living End | 37 | 3.36 |
| 4-Color Bean Cascade | 28 | 2.54 |
| Tier 3 | ||
| Jund Saga | 18 | 1.63 |
| Counter Cat | 16 | 1.45 |
| UW Bean Control | 14 | 1.27 |
| Esper Control | 13 | 1.18 |
| 4-Color Rhinos | 12 | 1.09 |
| UB Murktide | 11 | 1.00 |
| Bring to Light | 10 | 0.91 |
| 4-Color Creativity | 10 | 0.91 |
| Merfolk | 10 | 0.91 |
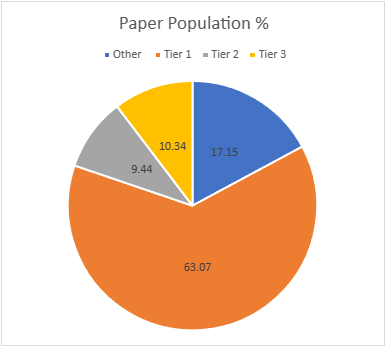
While Scam isn't quite as overpowering in paper as it was online, I wouldn't assume anything about that. MTGO's data always covers a wider spread of data from each event where paper rarely reports more than the Top 8. As such, we get a better look at what's happening in the Swiss from online than in paper. I suspect that Scam is just as prevalent overall in paper as online, but we can't actually see if that's true.
October Power Metagame
Tracking the metagame in terms of population is standard practice. But how do results actually factor in? Better decks should also have better results. In an effort to measure this, I use a power ranking system in addition to the prevalence list. By doing so, I measure the relative strengths of each deck within the metagame so that a deck that just squeaks into Top 32 isn't valued the same as one that Top 8's. This better reflects metagame potential.

For the MTGO data, points are awarded based on the population of the event. Preliminaries award points based on record (1 for 3 wins, 2 for 4 wins, 3 for 5), and Challenges are scored 3 points for the Top 8, 2 for Top 16, and 1 for Top 32. If I can find them, non-Wizards events will be awarded points the same as Challenges or Preliminaries depending on what the event in question reports/behaves like. Super Qualifiers and similar higher-level events get an extra point and so do other events if they’re over 200 players, with a fifth point for going over 400 players.
Due to paper reporting being inconsistent and frequently full of data gaps compared to MTGO, its points work differently. I award points based on the size of the tournament rather than placement. For events with no reported starting population or up to 32 players, one point is awarded to every deck. Events with 33 players up to 128 players get two points. From 129 players up to 512 players get three. Above 512 is four points, and five points will be reserved for Modern Pro Tours.
The MTGO Power Tiers
The higher population did yield more total points, though not many more. Total points rose from 1404 to 1490 in October. The adjusted average points were 14.42, therefore 15 points made Tier 3. The adjusted STDev was 23.59, so add 24 to the starting point, and Tier 3 runs to 39 points. Tier 2 starts with 40 points and runs to 64. Tier 1 requires at least 65 points.
A lot of decks fell in tier from paper to power, mostly out of Tier 1. Meanwhile, the new Temur Druid deck dropped off the tier list to be replaced by 4-Color Rhinos.
| Deck Name | Total Points | Total % |
|---|---|---|
| Tier 1 | ||
| Rakdos Scam | 380 | 25.50 |
| Yawgmoth | 117 | 7.85 |
| Amulet Titan | 85 | 5.70 |
| Burn | 81 | 5.44 |
| Tier 2 | ||
| Mono-Green Tron | 64 | 4.36 |
| Living End | 59 | 3.96 |
| 4-Color Control | 58 | 3.89 |
| Coffers | 58 | 3.89 |
| Hardened Scales | 57 | 3.83 |
| UR Murktide | 52 | 3.49 |
| 4-Color Bean Cascade | 50 | 3.56 |
| Temur Rhinos | 49 | 3.29 |
| Tier 3 | ||
| Hammer Time | 35 | 2.35 |
| Counter Cat | 27 | 1.81 |
| Bring to Light | 24 | 1.61 |
| 4-Color Bean Scam | 23 | 1.54 |
| UW Control | 21 | 1.41 |
| Wishshift | 18 | 1.21 |
| UB Murktide | 16 | 1.07 |
| 4-Color Rhinos | 16 | 1.07 |
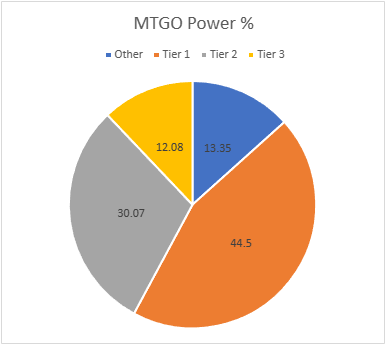
The concentration here isn't as bad as on population but is far from healthy. The increases in Tier 2 are entirely down to decks failing to make Tier 1.
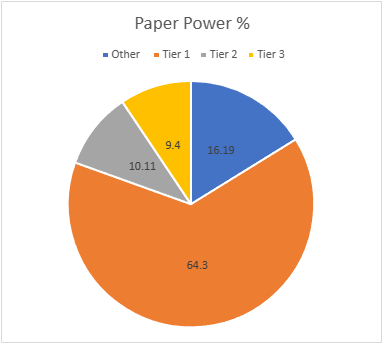
The Paper Power Tiers
As with the population, paper's points are up, and this time it's considerably higher. September saw 1412, but October surged to 1829. There weren't many large events, just tons of RCQs driving the increase. The adjusted average points were 15.26, setting the cutoff at 16 points. The STDev was 28.04, thus adding 28 to the starting point and Tier 3 runs to 44 points. Tier 2 starts with 45 points and runs to 73. Tier 1 requires at least 74 points. 4-Color Rhinos fell off and wasn't replaced by anything.
| Deck Name | Total # | Total % |
|---|---|---|
| Tier 1 | ||
| Rakdos Scam | 330 | 18.04 |
| Temur Rhinos | 122 | 6.67 |
| Amulet Titan | 109 | 5.96 |
| Yawgmoth | 102 | 5.58 |
| Burn | 97 | 5.30 |
| UR Murktide | 91 | 4.97 |
| Mono-Green Tron | 87 | 4.76 |
| Hardened Scales | 86 | 4.70 |
| Hammer Time | 77 | 4.21 |
| 4-Color Control | 75 | 4.10 |
| Tier 2 | ||
| Coffers | 68 | 3.72 |
| Living End | 68 | 3.72 |
| 4-Color Bean Cascade | 49 | 2.68 |
| Tier 3 | ||
| Jund Saga | 30 | 1.64 |
| 4-Color Rhinos | 27 | 1.48 |
| Counter Cat | 24 | 1.31 |
| UW Bean Control | 21 | 1.15 |
| Esper Control | 19 | 1.04 |
| Bring to Light | 18 | 0.98 |
| 4-Color Creativity | 17 | 0.93 |
| UB Murktide | 16 | 0.87 |
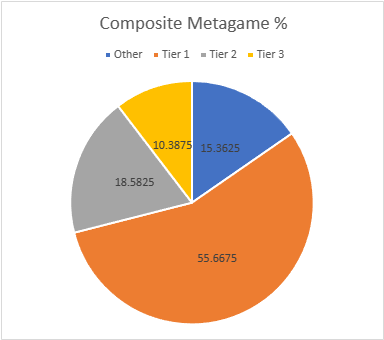
Composite Metagame
That's a lot of data, but what does it all mean? When Modern Nexus was first started, we had a statistical method to combine the MTGO and paper data, but the math of that system doesn't work without big paper events. I tried. Instead, I'm using an averaging system to combine the data. I take the MTGO results and average the tier, then separately average the paper results, then average the paper and MTGO results together for final tier placement.
This generates a lot of partial Tiers. That's not a bug, but a feature. The nuance separates the solidly Tiered decks from the more flexible ones and shows the true relative power differences between the decks. Every deck in the paper and MTGO results is on the table, and when they don't appear in a given category, they're marked N/A. This is treated as a 4 for averaging purposes.
| Deck Name | MTGO pop Tier | MTGO power Tier | MTGO Average Tier | Paper pop Tier | Paper Power Tier | Paper Average Tier | Composite Tier |
|---|---|---|---|---|---|---|---|
| Rakdos Scam | 1 | 1 | 1 | 1 | 1 | 1 | 1.00 |
| Yawgmoth | 1 | 1 | 1 | 1 | 1 | 1 | 1.00 |
| Amulet Titan | 1 | 1 | 1 | 1 | 1 | 1 | 1.00 |
| Burn | 1 | 1 | 1 | 1 | 1 | 1 | 1.00 |
| Mono-Green Tron | 1 | 2 | 1.5 | 1 | 1 | 1 | 1.25 |
| 4-Color Control | 1 | 2 | 1.5 | 1 | 1 | 1 | 1.25 |
| Hardened Scales | 2 | 2 | 2 | 1 | 1 | 1 | 1.50 |
| UR Murktide | 2 | 2 | 2 | 1 | 1 | 1 | 1.50 |
| Temur Rhinos | 2 | 2 | 2 | 1 | 1 | 1 | 1.50 |
| Hammer Time | 2 | 3 | 2.5 | 1 | 1 | 1 | 1.75 |
| Coffers | 2 | 2 | 2 | 2 | 2 | 2 | 2.00 |
| 4-Color Bean Cascade | 2 | 2 | 2 | 2 | 2 | 2 | 2.00 |
| Living End | 2 | 2 | 2 | 2 | 2 | 2 | 2.00 |
| Counter Cat | 3 | 3 | 3 | 3 | 3 | 3 | 3.00 |
| Bring to Light | 3 | 3 | 3 | 3 | 3 | 3 | 3.00 |
| UB Murktide | 3 | 3 | 3 | 3 | 3 | 3 | 3.00 |
| 4-Color Rhinos | N/A | 3 | 3.5 | 3 | 3 | 3 | 3.25 |
| 4-Color Bean Scam | 3 | 3 | 3 | N/A | N/A | N/A | 3.50 |
| UW Control | 3 | 3 | 3 | N/A | N/A | N/A | 3.50 |
| Wishshift | 3 | 3 | 3 | N/A | N/A | N/A | 3.50 |
| Jund Saga | N/A | N/A | N/A | 3 | 3 | 3 | 3.50 |
| UW Bean Control | N/A | N/A | N/A | 3 | 3 | 3 | 3.50 |
| Esper Control | N/A | N/A | N/A | 3 | 3 | 3 | 3.50 |
| 4-Color Creativity | N/A | N/A | N/A | 3 | 3 | 3 | 3.50 |
| Temur Druid | 3 | N/A | 3.5 | N/A | N/A | N/A | 3.75 |
| Merfolk | N/A | N/A | N/A | 3 | N/A | 3.5 | 3.75 |
Average Power Rankings
Finally, we come to the average power rankings. These are found by taking the total points earned and dividing them by total decks, to measure points per deck. I use this to measure strength vs. popularity. Measuring deck strength is hard. There is no Wins-Above-Replacement metric for Magic, and I'm not certain that one could be credibly devised. The game is too complex, and even then, power is very contextual.
Using the power rankings certainly helps and serves to show how justified a deck’s popularity is. However, more popular decks will still necessarily earn a lot of points. Therefore, the top tier doesn't move much between population and power and obscures whether its decks really earned their position.

This is where the averaging comes in. Decks that earn a lot of points because they get a lot of results will do worse than decks that win more events, indicating which deck actually performs better.
A higher average indicates lots of high finishes, whereas low averages result from mediocre performances and a high population. Lower-tier decks typically do very well here, likely due to their pilots being enthusiasts. Bear this in mind and be careful about reading too much into these results. However, as a general rule, decks that place above the baseline average are over-performing, and vice versa.
How far above or below that average a deck sits justifies its position on the power tiers. Decks well above baseline are undervalued, while decks well below baseline are very popular, but aren't necessarily good.
The Real Story
When considering the average points, the key is looking at how far off a deck is from the Baseline stat (the overall average of points/population). The closer a deck’s performance to the Baseline, the more likely it is to be performing close to its "true" potential.
A deck that is exactly average would therefore perform exactly as well as expected. The greater the deviation from the average, the more a deck under or over-performs. On the low end, a deck’s placing was mainly due to population rather than power, which suggests it’s overrated. A high-scoring deck is the opposite of this.
I'll begin with the averages for MTGO:
| Deck Name | Average Points | Power Tier |
|---|---|---|
| 4-Color Rhinos | 2.00 | 3 |
| Amulet Titan | 1.89 | 1 |
| Yawgmoth | 1.80 | 1 |
| Burn | 1.80 | 1 |
| Wishshift | 1.80 | 3 |
| UR Murktide | 1.73 | 2 |
| Living End | 1.69 | 2 |
| Temur Rhinos | 1.69 | 2 |
| 4-Color Bean Scam | 1.64 | 3 |
| Rakdos Scam | 1.61 | 1 |
| UW Control | 1.61 | 3 |
| UB Murktide | 1.60 | 3 |
| Coffers | 1.57 | 2 |
| Mono-Green Tron | 1.51 | 2 |
| Hardened Scales | 1.50 | 2 |
| Baseline | 1.50 | |
| Counter Cat | 1.50 | 3 |
| Bring to Light | 1.50 | 3 |
| 4-Color Control | 1.42 | 2 |
| 4-Color Bean Cascade | 1.39 | 2 |
| Hammer Time | 1.35 | 3 |
Thanks to its tendency to Top 16 without putting up many Top 32 results, Amulet Titan is the MTGO Deck of October.
Now the paper averages:
| Deck Name | Average Power | Power Tier |
|---|---|---|
| 4-Color Rhinos | 2.25 | 3 |
| Burn | 1.90 | 1 |
| Living End | 1.84 | 2 |
| Hardened Scales | 1.83 | 1 |
| Bring to Light | 1.80 | 3 |
| 4-Color Bean Cascade | 1.75 | 2 |
| Coffers | 1.74 | 2 |
| Amulet Titan | 1.73 | 1 |
| Rakdos Scam | 1.72 | 1 |
| Temur Rhinos | 1.72 | 1 |
| 4-Color Creativity | 1.70 | 3 |
| Jund Saga | 1.67 | 3 |
| Yawgmoth | 1.64 | 1 |
| UR Murktide | 1.60 | 1 |
| Mono-Green Tron | 1.58 | 1 |
| Hammer Time | 1.57 | 1 |
| 4-Color Control | 1.56 | 1 |
| Counter Cat | 1.50 | 3 |
| UW Bean Control | 1.50 | 3 |
| Baseline | 1.48 | |
| Esper Control | 1.46 | 3 |
| UB Murktide | 1.45 | 3 |
There really is something to be said for consistency as Burn takes the Paper Deck of October.
Analysis
So, Wizards. How's that No Changes working out for you then? There's nothing in Lost Caverns of Ixalan that looks able to disrupt Modern enough to dethrone or even simply mitigate Scam's metagame dominance. As a result, I'm looking to the next ban window in December for relief.
This does ask the question of what constitutes a Tier 0 deck. I've never defined it before because other than Eldrazi Winter we've never really had to. The definitions used for the normal tiers don't work as there'd always be a Tier 0 deck by the numbers. In the past it's been so obvious when that situation arose that it wasn't needed. Eldrazi and Hogaak were not only showing up in huge numbers but were also winning everything. Neither Scam nor Murktide before it has crossed that particular threshold.
Other than not winning enough, Scam's metagame share isn't quite high enough to match previous Tier 0 decks. Eldrazi had a higher metagame percentage than all of Tier 1 at its height. Though Scam accounts for ~25% of MTGO's data and ~20% overall, that ~25% of Tier 1 that isn't Scam. Thus, this situation feels very bad, but I wouldn't say that this is a Tier 0 situation yet. But I am preparing for it to move that direction.
Silver Linings
The good news in all this mess is that there is still innovation happening in Modern. The new Temur Druid deck is a hybrid deck held together by Questing Druid // Seek the Beast. It takes the gameplay style of Izzet Prowess and marries it to Murktide's creatures to make a deck very reminiscent of old-school Growth decks. The deck seems to live or die on its ability to just bury opponents under all the cards it churns through. I expect it to stick around for no other reason than such gameplay is quite popular.


The other development I'm tracking is a resurgence of combo decks. I realize that the only combo deck to make the tier list was Wishshift, but there were a surprising number of combo decks below the tiers, far more than normal. This is almost certainly the fault of all the Up the Beanstalk decks. They're punishing for fair decks to play against but have very few ways to disrupt combo decks (or Burn, for that matter). Assuming trends continue, I suspect more combo decks to make the list in November.
Market Movements
The market driver in November will be Lost Caverns. There are some interesting role-players for Modern, but nothing that I'd expect to have much opportunity for growth. The big mover is likely to be demand for Cavern of Souls in Pioneer. It's an automatic 4-of in Humans and will see at least some play in Spirits. There are likely to be more decks that will try Cavern as well, so it should be easy to move.
That being said, I would advise caution. Outside of the new sets, there's persistent downward price pressure in the market. Players are getting overwhelmed with all the product releases and there's fatigue in the market. Keep that in mind.
