Are you a Quiet Speculation member?
If not, now is a perfect time to join up! Our powerful tools, breaking-news analysis, and exclusive Discord channel will make sure you stay up to date and ahead of the curve.
It's time for the first update of the new year. The Regional Championships are beginning and these, coupled with Magic Online Qualifiers, exerted an outsized pull on the metagame. I expect the trends to continue into February, but there's a chance for turbulence and a metagame shift in the incoming month.
An Expected Outlier
Boros Energy is an outlier. Again. Not by the margins it once was, but it remains the principal deck in the Modern metagame despite being weakened. It's nowhere near as bad as it was pre-ban, but I imagine many readers will still be frustrated. However, I do have to wonder (though it's impossible to determine) if Energy's continued dominance is the result of it still being overpowered, or if players are so familiar with it, they have no reason to switch. Either way, it really isn't a surprising outcome.
What is surprising is that it's the only outlier. I thought there'd be more given how the data shook out. However, the tests came back...confused. Half the tests had Boros as the only outlier. The other half had anywhere from 3 to 10 outliers. I'm chalking that up to the data being weird and the known flaws in determining outliers more than anything, which is why I only removed the one.
As always, outliers are removed from the statistical analysis but are reported in their correct place on the Tier List.
January Population Metagame
To make the tier list, a given deck has to beat the overall average population for the month. The average is my estimate for how many results a given deck "should" produce in a given month. To be considered a tiered deck, it must perform better than "good enough". Every deck that posts at least the average number of results is "good enough" and makes the tier list.
Then we go one standard deviation (STdev) above average to set the limit of Tier 3 and the cutoff for Tier 2. This mathematically defines Tier 3 as those decks clustered near the average. Tier 2 goes from the cutoff to the next standard deviation. These are decks that perform well above average. Tier 1 consists of those decks at least two standard deviations above the mean result, encompassing the truly exceptional performing decks.
The MTGO data nearly exclusively comes from official Preliminary and Challenge results. Leagues are excluded, as they add analytically useless bulk data to both the population and power tiers. The paper data comes from any source I can find, with all reported events being counted.
While the MTGO events report predictable numbers, paper events can report anything from only the winner to all the results. In the latter case, if match results aren't included, I'll take as much of the Top 32 as possible. If match results are reported, I'll take winning record up to Top 32, and then any additional decks tied with 32nd place, as tiebreakers are a magic most foul and black.
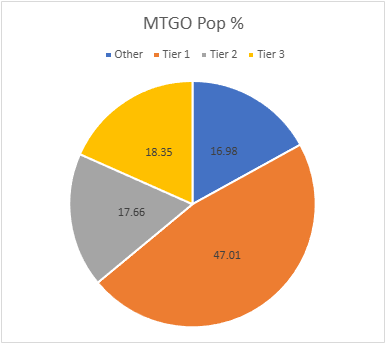
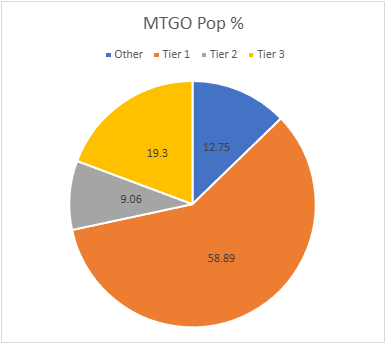
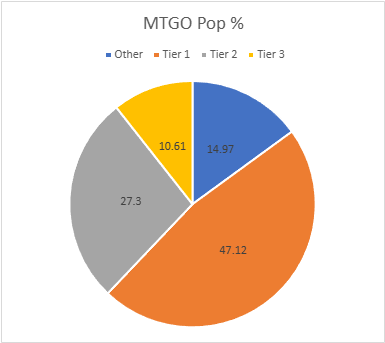
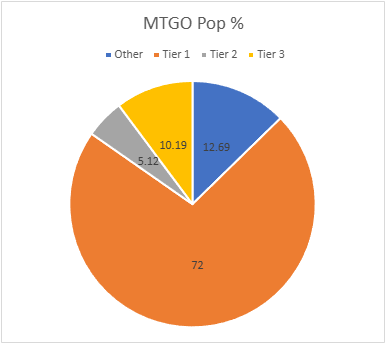
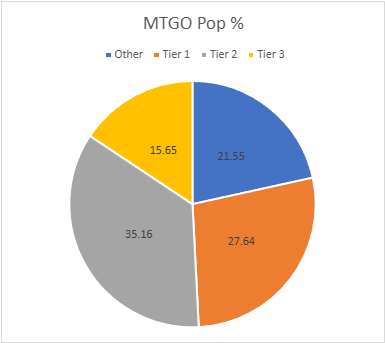
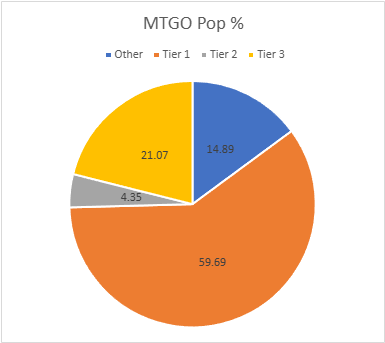
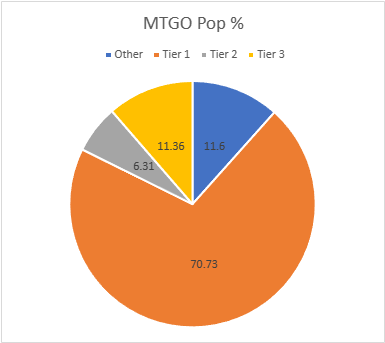
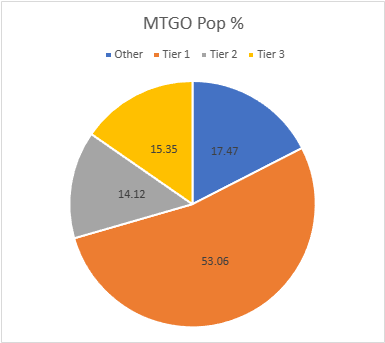
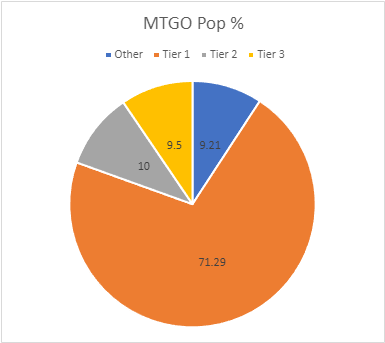
The MTGO Population Data
January's adjusted average population for MTGO is 13.19. I always round down if the decimal is less than .20. Tier 3, therefore, begins with decks posting 13 results. The adjusted STdev was 31.67, so add 32 and that means Tier 3 runs to 45 results. Again, it's the starting point to the cutoff, then the next whole number for the next Tier. Therefore Tier 2 starts with 46 results and runs to 78. Subsequently, to make Tier 1, 79 decks are required.
The sample population always rises in January thanks to Championship Qualifiers and in previous years, larger than average Preliminaries. I have 1600 decks in my sample, all Challenge and Qualifier results. Good news, they were all much larger Challenges than before. Online Modern appears to be healing and more importantly, I don't have to change anything about my system.
While I have 98 unique decks in my sample, that only equates to a unique deck ratio of .061, which is meaninglessly lower than it was pre-ban. That is not a good sign. The number of tiered decks is 19, which is a slight improvement from November but very low compared to the rest of 2024. This isn't starting out promisingly.
| Deck Name | Total # | Total % |
|---|---|---|
| Tier 1 | ||
| Boros Energy | 321 | 20.06 |
| Abhorrent Frogtide | 183 | 11.44 |
| MG Eldrazi | 180 | 11.25 |
| Temur Breach Combo | 131 | 8.19 |
| Tameshi Belcher | 87 | 5.44 |
| WB Blink | 84 | 5.25 |
| Tier 2 | ||
| Ruby Storm | 68 | 4.25 |
| Mardu Energy | 51 | 3.19 |
| Tier 3 | ||
| Amulet Titan | 43 | 2.69 |
| Yawgmoth | 37 | 2.31 |
| 4-C Breach Combo | 33 | 2.06 |
| Temur Breach Storm | 23 | 1.44 |
| Kappa | 21 | 1.31 |
| Broodscale Combo | 19 | 1.19 |
| Hollow One | 17 | 1.06 |
| Jund Creativity | 16 | 1.00 |
| Living End | 15 | 0.94 |
| Mill | 13 | 0.81 |
| Jeskai Energy | 13 | 0.81 |

How it Happened
This looks poor, but before passing judgement, there's a complicated story behind January's online data. About 1/3 of Boros' and 3/4 of Abhorrent Frogtide's results came from the first week of January. The next week, both fell off as Temur Breach Combo and WB Blink appeared and surged up the standings. By week three, both the newcomers fell off the pace and Boros started picking up again. Base-Green Eldrazi was fairly steady all month, though it had a better final week than the others.
I believe that online players stuck by Boros and Frogtide initially because they didn't know what else to play. They're optimizers, not innovators. Lacking any special reason to look for new decks, they just stuck to their standbys. Once Breach and Blink emerged, they switched over with gusto. Playing the same thing forever is boring and they were just waiting for someone else to put in the effort of figuring out new decks.
Breach, however, is hard to play, while Blink has consistency issues and can be quite slow to play, which is bad with a chess-clock. Consequently, they began moving back to Boros. Frogtide has a bad blink matchup and I'll be very surprised if it's Tier 1 in February. The rest of the field seemed to just chug along regardless of what happened among the Tier 1 decks despite the most prolific players concluding there are only 4 decks to play.
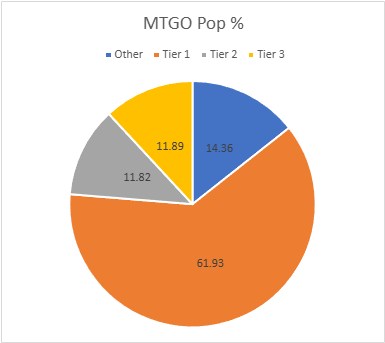
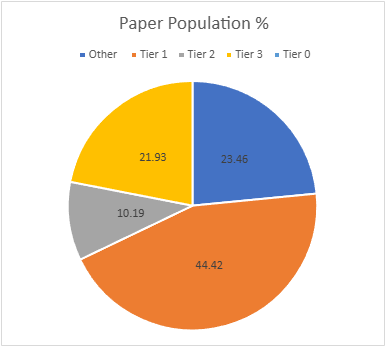
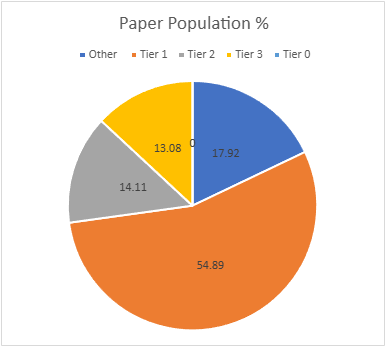
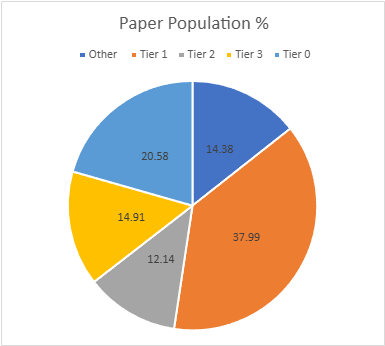
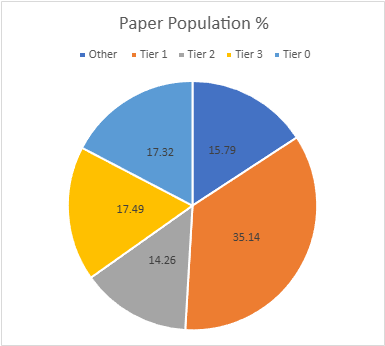
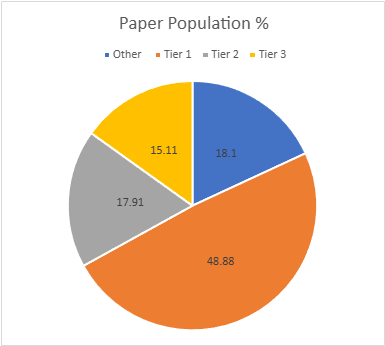
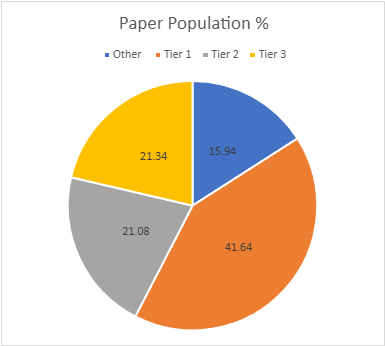
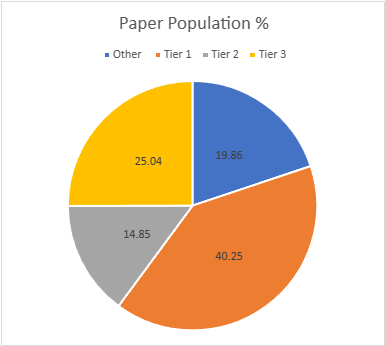
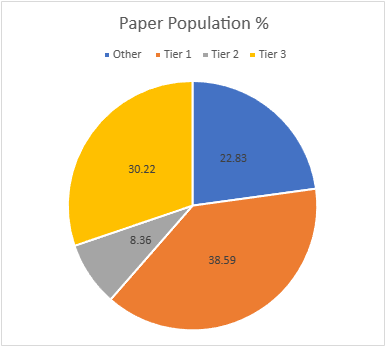
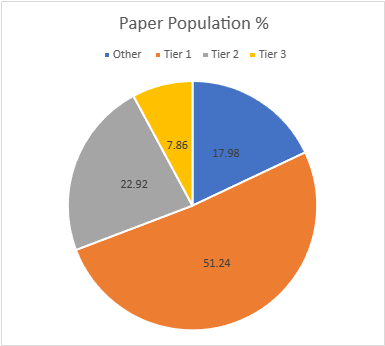
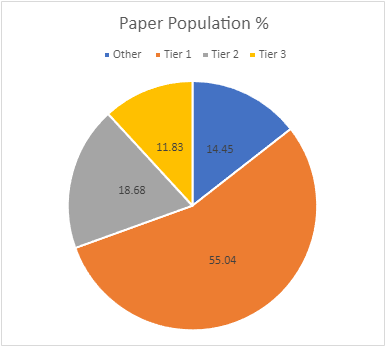
The Paper Population Data
Meanwhile in paper the population has somewhat recovered. Thanks to the RC's and some other large events, paper saw 689 decks. Not great compared to other years, but stores aren't reporting events as diligently as they used to. Some in my area that used to post results to MTGTop8 now only post to their own websites and I'd guess that's the same story globally. In any case, there were 93 unique decks and a ratio of .135. That's a fairly middling diversity ratio by paper standards, but it's still a lot better than MTGO.
25 decks made the tier list, which is decent but not exceptional by paper standards. The adjusted average population is 6.48, so 7 results make the list. The adjusted STDev was 11.24, so the increment is 12. Therefore, Tier 3 runs from 7 to 19, Tier 2 is 20 to 32, and Tier 1 is 33 and over.
| Deck Name | Total # | Total % |
|---|---|---|
| Tier 1 | ||
| Boros Energy | 93 | 13.50 |
| Abhorrent Frogtide | 69 | 10.01 |
| Temur Breach Combo | 54 | 7.84 |
| Mardu Energy | 40 | 5.80 |
| MG Eldrazi | 33 | 4.79 |
| Tier 2 | ||
| Amulet Titan | 30 | 4.35 |
| Tameshi Belcher | 27 | 3.92 |
| WB Blink | 22 | 3.19 |
| Yawgmoth | 20 | 2.90 |
| Tier 3 | ||
| Goryo Blink | 19 | 2.76 |
| Domain Zoo | 18 | 2.61 |
| Burn | 14 | 2.03 |
| Jeskai Control | 14 | 2.03 |
| Domain Rhinos | 13 | 1.89 |
| Ruby Storm | 13 | 1.89 |
| Kappa | 12 | 1.74 |
| Hollow One | 10 | 1.45 |
| Broodscale Combo | 9 | 1.31 |
| Oculus Frog | 9 | 1.31 |
| Hammer Time | 8 | 1.16 |
| Jund Creativity | 7 | 1.02 |
| Merfolk | 7 | 1.02 |
| eldrazi Breach | 7 | 1.02 |
| 4-C Rhinos | 7 | 1.02 |
| 4-C Breach | 7 | 1.02 |

Boros is only an outlier thanks to the impact of the big events. It just barely held the #1 spot when only the local events were entered. That might suggest that MTGO influences paper thanks to players playtesting online and/or choosing their decks based on that metagame. However, contrarily smaller events almost always report the same decks we see online. Medium-sized events show far more innovation and diversity than the large and small ones. You'd think that players would fly their freak flags highest in the smallest events, but that's not what I see every month.
January Power Metagame
Tracking the metagame in terms of population is standard practice. But how do results actually factor in? Better decks should also have better results. In an effort to measure this, I use a power ranking system in addition to the prevalence list. By doing so, I measure the relative strengths of each deck within the metagame so that a deck that just squeaks into Top 32 isn't valued the same as one that Top 8's. This better reflects metagame potential.
For the MTGO data, points are awarded based on the population of the event. Preliminaries award points based on record (1 for 3 wins, 2 for 4 wins, 3 for 5), and Challenges are scored 3 points for the Top 8, 2 for Top 16, and 1 for Top 32. If I can find them, non-Wizards events will be awarded points the same as Challenges or Preliminaries depending on what the event in question reports/behaves like. Super Qualifiers and similar higher-level events get an extra point and so do other events if they’re over 200 players, with a fifth point for going over 400 players.
Due to paper reporting being inconsistent and frequently full of data gaps compared to MTGO, its points work differently. I award points based on the size of the tournament rather than placement. For events with no reported starting population or up to 32 players, one point is awarded to every deck. Events with 33 players up to 128 players get two points. From 129 players up to 512 players get three. Above 512 is four points, and five points is reserved for Modern Pro Tours. When paper reports more than the Top 8, which is rare, I take all the decks with a winning record or tied for Top 32, whichever is pertinent.
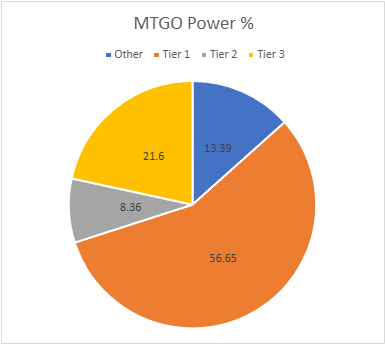
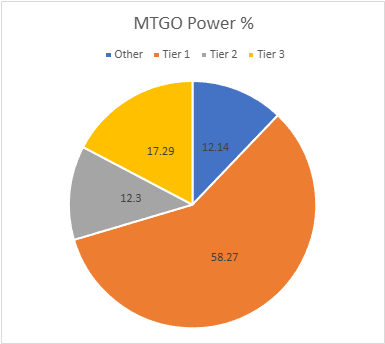
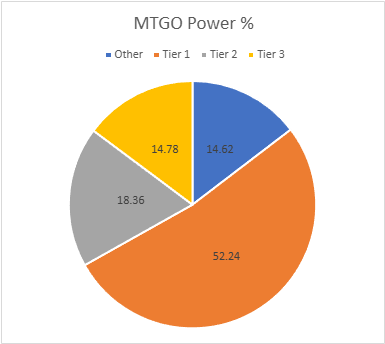
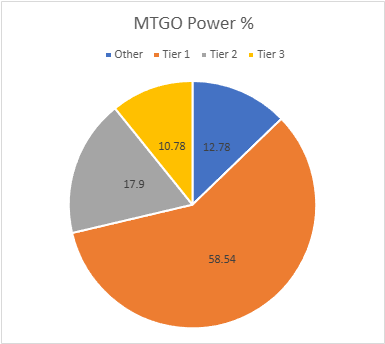
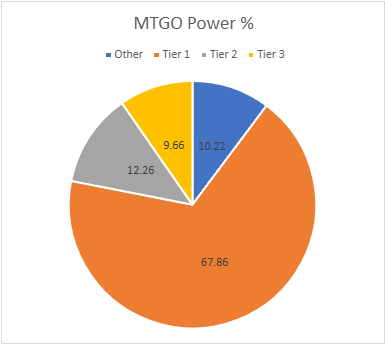
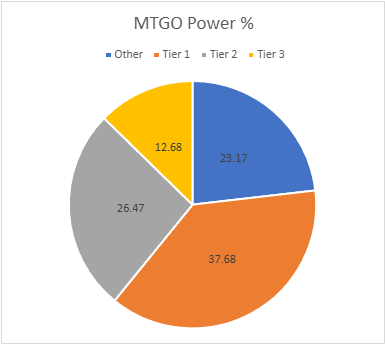
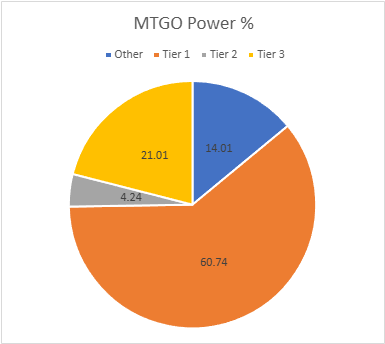
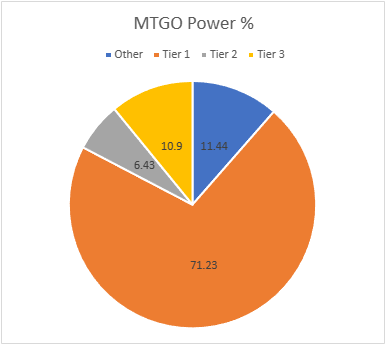
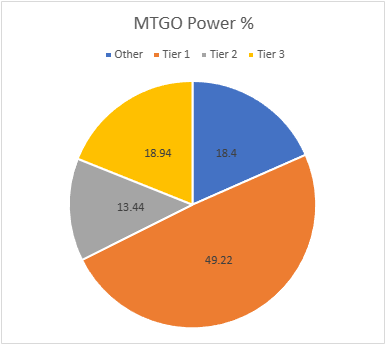
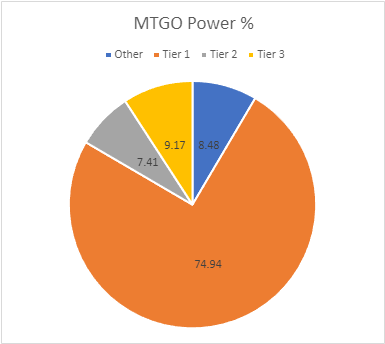
The MTGO Power Tiers
As with the population numbers, total points always rise in January and this time they hit 2896. The adjusted average points were 23.93, therefore 24 points made Tier 3. The STDev was 60.75, so add 61 to the starting point, and Tier 3 runs to 85 points. Tier 2 starts with 86 points and runs to 147. Tier 1 requires at least 148 points. Nothing new joined the tier list, but both Living End and Mill fell off.
| Deck Name | Total Points | Total % |
|---|---|---|
| Tier 1 | ||
| Boros Energy | 575 | 19.85 |
| MG Eldrazi | 353 | 12.19 |
| Abhorrent Frogtide | 329 | 11.36 |
| Temur Breach Combo | 271 | 9.358 |
| Tameshi Belcher | 171 | 5.90 |
| WB Blink | 160 | 5.52 |
| Tier 2 | ||
| Ruby Storm | 119 | 4.11 |
| Mardu Energy | 95 | 3.28 |
| Tier 3 | ||
| Amulet Titan | 80 | 2.76 |
| Yawgmoth | 69 | 2.38 |
| 4-C Breach Combo | 57 | 1.97 |
| Temur Breach Storm | 49 | 1.69 |
| Kappa | 31 | 1.07 |
| Broodscale Combo | 31 | 1.07 |
| Jeskai Energy | 26 | 0.90 |
| Hollow One | 24 | 0.83 |
| Jund Creativity | 24 | 0.83 |

Boros actually lost metagame percentage on the power tier. I can't remember this happening before. Again, during the first week Boros was topping the standings quite consistently. However, once players began switching off Energy, it was relegated to the Top 32, and even after players picked it back up it didn't dominate the Top 8 as often as it used to. Frogtide stopped appearing that often, but when it did it was usually Top 16 or better, letting it hold position. Eldrazi and Breach were all over the place initially but then went on a Top 8 tear towards the end, which is how it gained so much ground on Energy.
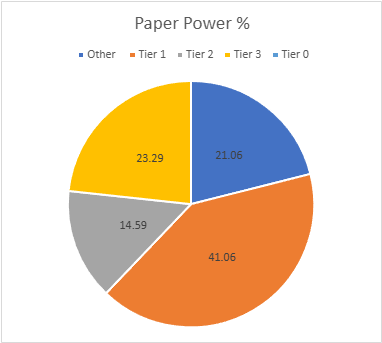
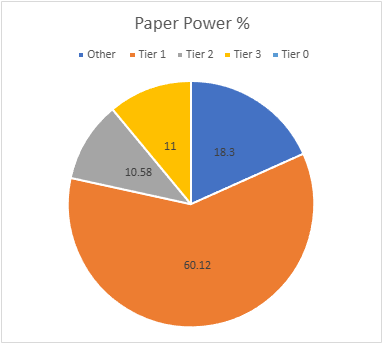
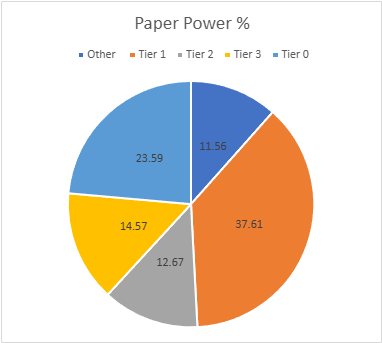
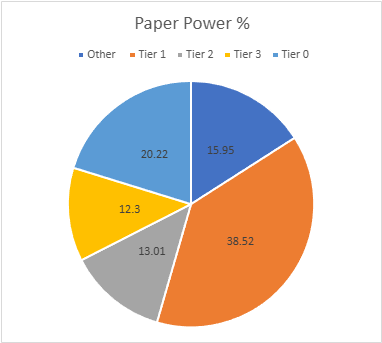
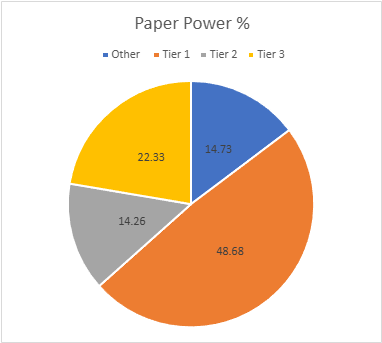
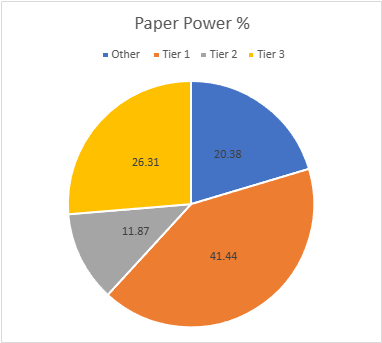
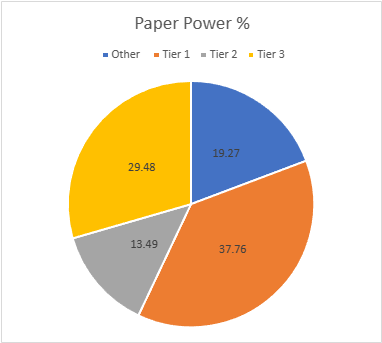
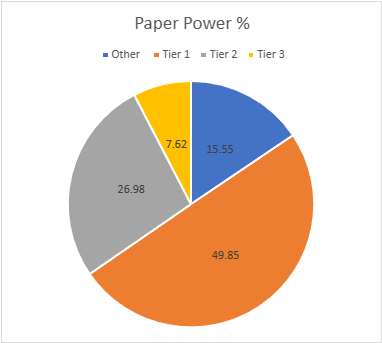
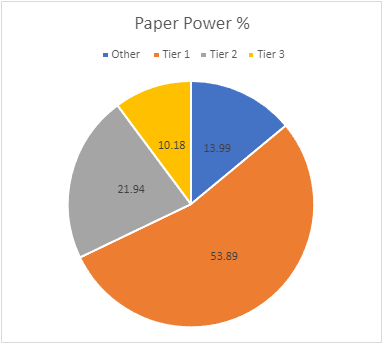
The Paper Power Tiers
Paper's total points are fairly average at 1275. The adjusted average points were 11.68, setting the cutoff at 12 points. The STDev was 21.55, thus add 22 to the starting point and Tier 3 runs to 34 points. Tier 2 starts with 35 points and runs to 57. Tier 1 requires at least 58 points. Hammer Time didn't survive the cut and was replaced by Temur Breach Storm.
| Deck Name | Total Points | Total % |
|---|---|---|
| Tier 1 | ||
| Boros Energy | 200 | 15.69 |
| Abhorrent Frogtide | 121 | 9.49 |
| Temur Breach Combo | 118 | 9.25 |
| MG Eldrazi | 77 | 6.04 |
| Mardu Energy | 64 | 5.02 |
| Tier 2 | ||
| Amulet Titan | 56 | 4.39 |
| Tameshi Belcher | 48 | 3.76 |
| WB Blink | 42 | 3.29 |
| Yawgmoth | 39 | 3.06 |
| Goryo Blink | 39 | 3.06 |
| Tier 3 | ||
| Domain Zoo | 32 | 2.51 |
| Ruby Storm | 23 | 1.80 |
| Burn | 22 | 1.72 |
| Domain Rhinos | 21 | 1.65 |
| 4-C Breach | 19 | 1.49 |
| Kappa | 17 | 1.33 |
| Jeskai Control | 16 | 1.25 |
| Hollow One | 16 | 1.25 |
| Temur Breach Storm | 16 | 1.25 |
| Broodscale Combo | 15 | 1.18 |
| Oculus Frog | 15 | 1.18 |
| eldrazi Breach | 15 | 1.18 |
| 4-C Rhinos | 14 | 1.10 |
| Jund Creativity | 13 | 1.02 |
| Merfolk | 12 | 0.94 |
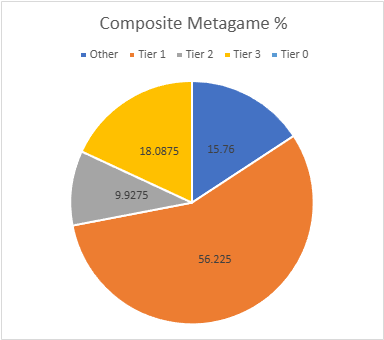
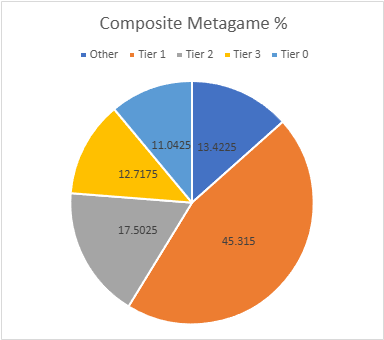
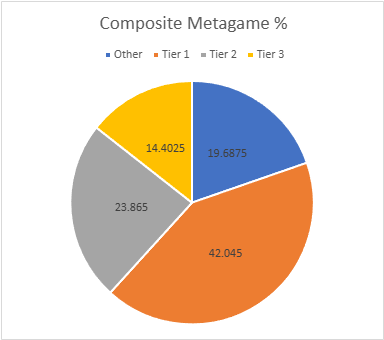
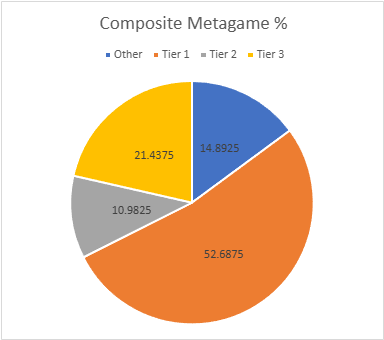
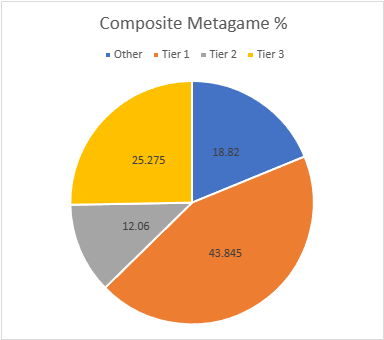
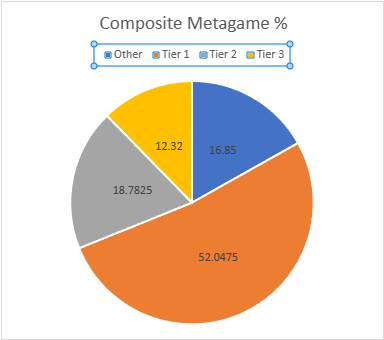
Composite Metagame
That's a lot of data, but what does it all mean? When Modern Nexus was first started, we had a statistical method to combine the MTGO and paper data, but the math of that system doesn't work without big paper events. I tried. Instead, I'm using an averaging system to combine the data. I take the MTGO results and average the tier, then separately average the paper results, then average the paper and MTGO results together for final tier placement.
This generates a lot of partial Tiers. That's not a bug, but a feature. The nuance separates the solidly Tiered decks from the more flexible ones and shows the true relative power differences between the decks. Every deck in the paper and MTGO results is on the table, and when they don't appear in a given category, they're marked N/A. This is treated as a 4 for averaging purposes.
| Deck Name | MTGO Pop Tier | MTGO Power Tier | MTGO Average Tier | Paper Pop Tier | Paper Power Tier | Paper Average Tier | Composite Tier |
|---|---|---|---|---|---|---|---|
| Boros Energy | 1 | 1 | 1 | 1 | 1 | 1 | 1.00 |
| Abhorrent Frogtide | 1 | 1 | 1 | 1 | 1 | 1 | 1.00 |
| MG Eldrazi | 1 | 1 | 1 | 1 | 1 | 1 | 1.00 |
| Temur Breach Combo | 1 | 1 | 1 | 1 | 1 | 1 | 1.00 |
| Tameshi Belcher | 1 | 1 | 1 | 2 | 2 | 2 | 1.50 |
| WB Blink | 1 | 1 | 1 | 2 | 2 | 2 | 1.50 |
| Mardu Energy | 2 | 2 | 2 | 1 | 1 | 1 | 1.50 |
| Ruby Storm | 2 | 2 | 2 | 3 | 3 | 3 | 2.50 |
| Amulet Titan | 3 | 3 | 3 | 2 | 2 | 2 | 2.50 |
| Yawgmoth | 3 | 3 | 3 | 2 | 2 | 2 | 2.50 |
| 4-C Breach Combo | 3 | 3 | 3 | 3 | 3 | 3 | 3.00 |
| Kappa | 3 | 3 | 3 | 3 | 3 | 3 | 3.00 |
| Broodscale Combo | 3 | 3 | 3 | 3 | 3 | 3 | 3.00 |
| Hollow One | 3 | 3 | 3 | 3 | 3 | 3 | 3.00 |
| Jund Creativity | 3 | 3 | 3 | 3 | 3 | 3 | 3.00 |
| Temur Breach Storm | 3 | 3 | 3 | N/A | 3 | 3.5 | 3.25 |
| Goryo Blink | N/A | N/A | N/A | 3 | 2 | 2.5 | 3.25 |
| Jeskai Energy | 3 | 3 | 3 | N/A | N/A | N/A | 3.50 |
| Domain Zoo | N/A | N/A | N/A | 3 | 3 | 3 | 3.50 |
| Burn | N/A | N/A | N/A | 3 | 3 | 3 | 3.50 |
| Jeskai Control | N/A | N/A | N/A | 3 | 3 | 3 | 3.50 |
| Domain Rhinos | N/A | N/A | N/A | 3 | 3 | 3 | 3.50 |
| Oculus Frog | N/A | N/A | N/A | 3 | 3 | 3 | 3.50 |
| Merfolk | N/A | N/A | N/A | 3 | 3 | 3 | 3.50 |
| Eldrazi Breach | N/A | N/A | N/A | 3 | 3 | 3 | 3.50 |
| 4-C Rhinos | N/A | N/A | N/A | 3 | 3 | 3 | 3.50 |
| Living End | 3 | N/A | 3.5 | N/A | N/A | N/A | 3.75 |
| Mill | 3 | N/A | 3.5 | N/A | N/A | N/A | 3.75 |
| Hammer Time | N/A | N/A | N/A | 3 | N/A | 3.5 | 3.75 |

Average Power Rankings
Finally, we come to the average power rankings. These are found by taking the total points earned and dividing them by total decks, to measure points per deck. I use this to measure strength vs. popularity. Measuring deck strength is hard. There is no Wins-Above-Replacement metric for Magic, and I'm not certain that one could be credibly devised. The game is too complex, and even then, power is very contextual.
Using the power rankings helps to show how justified a deck’s popularity is. However, more popular decks will still necessarily earn a lot of points. Therefore, the top tier doesn't move much between population and power and obscures whether its decks really earned their position.
This is where the averaging comes in. Decks that earn a lot of points because they get a lot of results will do worse than decks that win more events, indicating which deck actually performs better.
A higher average indicates lots of high finishes, whereas low averages result from mediocre performances and a high population. Lower-tier decks typically do very well here, likely due to their pilots being enthusiasts. Bear this in mind and be careful about reading too much into these results. However, as a general rule, decks that place above the baseline average are over-performing, and vice versa.
How far above or below that average a deck sits justifies its position on the power tiers. Decks well above baseline are undervalued, while decks well below baseline are very popular, but aren't necessarily good.
The Real Story
When considering the average points, the key is looking at how far off a deck is from the Baseline stat (the overall average of points/population). The closer a deck’s performance to the Baseline, the more likely it is to be performing close to its "true" potential.
A deck that is exactly average would therefore perform exactly as well as expected. The greater the deviation from the average, the more a deck under or over-performs. On the low end, a deck’s placing was mainly due to population rather than power, which suggests it’s overrated. A high-scoring deck is the opposite of this.
I'll begin with the averages for MTGO:
| Deck Name | Average Points | Power Tier |
|---|---|---|
| Temur Breach Storm | 2.13 | 3 |
| Temur Breach Combo | 2.07 | 1 |
| Jeskai Energy | 2.00 | 3 |
| MG Eldrazi | 1.96 | 1 |
| Tameshi Belcher | 1.96 | 1 |
| WB Blink | 1.90 | 1 |
| Mardu Energy | 1.86 | 2 |
| Amulet Titan | 1.86 | 3 |
| Yawgmoth | 1.86 | 3 |
| Abhorrent Frogtide | 1.80 | 1 |
| Boros Energy | 1.79 | 1 |
| Ruby Storm | 1.75 | 2 |
| 4-C Breach Combo | 1.73 | 3 |
| Mill | 1.69 | N/A |
| Broodscale Combo | 1.63 | 3 |
| Baseline | 1.62 | |
| Jund Creativity | 1.50 | 3 |
| Kappa | 1.48 | 3 |
| Hollow One | 1.41 | 3 |
| Living End | 1.40 | N/A |
Temur Breach Combo is MTGO Deck of January by a decent margin. I'll highlight Boros' average being the lowest of the Tier 1 decks.
Now the paper averages:
| Deck Name | Average Points | Power Tier |
|---|---|---|
| 4-C Breach | 2.71 | 3 |
| Temur Breach Storm | 2.67 | 3 |
| MG Eldrazi | 2.33 | 1 |
| Temur Breach Combo | 2.18 | 1 |
| Boros Energy | 2.15 | 1 |
| eldrazi Breach | 2.14 | 3 |
| Goryo Blink | 2.05 | 2 |
| 4-C Rhinos | 2.00 | 3 |
| Yawgmoth | 1.95 | 2 |
| WB Blink | 1.91 | 2 |
| Amulet Titan | 1.87 | 2 |
| Jund Creativity | 1.86 | 3 |
| Tameshi Belcher | 1.78 | 2 |
| Domain Zoo | 1.78 | 3 |
| Ruby Storm | 1.77 | 3 |
| Abhorrent Frogtide | 1.75 | 1 |
| Merfolk | 1.71 | 3 |
| Tier 1 | 1.71 | |
| Broodscale Combo | 1.67 | 3 |
| Oculus Frog | 1.67 | 3 |
| Domain Rhinos | 1.61 | 3 |
| Mardu Energy | 1.60 | 1 |
| Hollow One | 1.60 | 3 |
| Burn | 1.57 | 3 |
| Kappa | 1.42 | 3 |
| Hammer Time | 1.25 | N/A |
| Jeskai Control | 1.14 | 3 |
Eldrazi wins Paper Deck of January, and it really wasn't close. That'll happen when you show up strongly in RC standings but not in the other events.
Analysis
The December 16th BnR hasn't improved Modern's diversity as much as I suspect many wanted. That'll happen when the goal is only to weaken the best decks without killing them. I'm encouraged that BW Blink came out of nowhere and is performing well, but Energy's continued place at the top of the metagame is a strong limiting factor.
That said, Wizards' strategic goal has been achieved. Attendance across Modern events cratered in both November and December. It hasn't fully recovered yet, but numbers have significantly improved. Players want to play Modern again.
Prognostication
It's too early to speculate on another round of bannings/unbannings. There are a lot of RCs still to play and a new set is due to release. These factors will cause metagame turbulence. How much turbulence is impossible to say. If there's enough to really shake up the metagame, then I'd expect nothing to happen on March 31st. However, if it's more like throwing a pebble in the ocean, more action may be required.
The reason that action may be needed isn't because anything is horribly overpowered like it was before. It will be because Wizards has to avoid past sins. They failed to take action against Nadu, Winged Victory and The One Ring in timely fashion, and as a result Modern's last RCQ season was boring and unpopular. They can't risk another 6 months of bad, of stale Modern and may take action just to keep things moving.
Aetherdrift Ahead
Modern stands to receive some interesting role players from Aetherdrift, but those aren't enough to shake anything up. Sorry Hollow One players, but the discard value cards aren't going to make you into Tier 1 decks. You might get more competitive, but not that competitive. It'll be the engine cards that have real impact, assuming they're as good as the hype speculated.
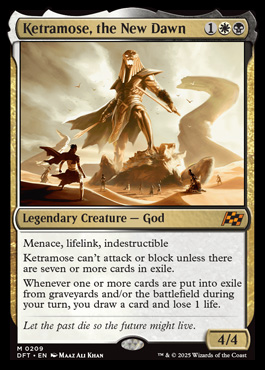
Ketramose, the New Dawn was spoiled early and looks like it would slot right into BW Blink. Exiling for value being its whole thing and Ketramose provides an additional angle to gain value. I'm not convinced that'll work out. Blink's biggest issue is that it often spends the first few turns doing nothing while its value engines come online, and Ketramose just adds fuel to that fire. I know that it's being worked on and will see play after release. I'm just skeptical that it will work in the current lists. It's more likely that a completely retooled deck will rise instead.
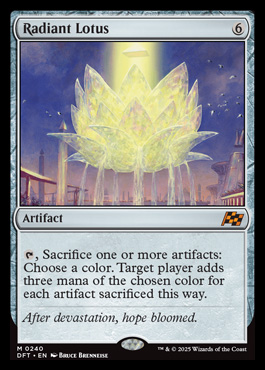
Radiant Lotus is the other engine, and on its face looks to do a decent Krak-Clan Ironworks impression. However, this ability isn't a mana ability and can be Tishana's Tidebindered. That won't limit its playability but may be a ceiling to success. Ironworks won a lot more than it should've by abusing timing rules around mana abilities and Lotus can't do that. Worse, it's competing with Breach decks in the artifact combo space. That's a lot of splash damage for a new deck to overcome, even if it doesn't directly compete with Breach in the combo space. However, I still expect it to see considerable play up front.
Financial Impact
Lotus and Ketramose are the top of the speculative heap, Modern-wise. At this point, I wouldn't buy into either card directly but look to the supporting cast for demand-driven price increases. The supporting cast will move even if the flagship doesn't pan out since they're useful elsewhere. Affinity supports, in general, should be picked up for speculation as there are a lot of cards with the mechanic in Aetherdrift, and it's plausible that some new ones will see play and trigger more Affinity decks seeing play.