Are you a Quiet Speculation member?
If not, now is a perfect time to join up! Our powerful tools, breaking-news analysis, and exclusive Discord channel will make sure you stay up to date and ahead of the curve.
How apropos that the Metagame Update is falling on the same day that Innistrad: Midnight Hunt spoilers begin. It's a perfect transition from the metagame we knew to the new one to come. However new it actually is or isn't is irrelevant. The addition of new cards creates new possibilities which alone change the metagame dynamics. And we already know of one card that will absolutely see play, so I feel confidant saying that the metagame will be shaken up. Again. It may be more accurate to say that Modern is getting continuously shaken up these days.
August's data is a huge turnaround compared the past few months. For one, the total decks are considerably up, back toward what I'd consider and average month. After 5 months of below 500 population, I was pleasantly surprised to be over 500 for the first time since January. And I wasn't even including non-Wizards events to get those numbers up. However, this didn't mean that the Tier lists became more average and the overall picture has the metagame pulling in several directions. I'm not entirely sure what it means yet, and given the incoming sets I'm not sure we'll ever find out. But anything is possible and there's plenty of opportunities to find out.
August Metagame
To make the tier list, a given deck has to beat the overall average population for the month.  The average is my estimate for how many results a given deck “should” produce on MTGO. Being a tiered deck requires being better than “good enough;” in July the average population was 6.44, meaning a deck needed 7 results to beat the average and make Tier 3. This means that the cutoff is the same as July's despite the actual average being slightly down. That's just what happens when you have a system with hard cutoffs in place.
Speaking of the cutoff, that's where Tier 3 starts. Then we go one standard deviation above average to set the limit of Tier 3 and cutoff for Tier 2. The STdev was 10.39, which means that means Tier 3 runs to 18. Again, it's the starting point to the cutoff, then one above for the next Tier. Therefore Tier 2 starts with 19 results and runs to 30. Subsequently, to make Tier 1, 31 decks are required. This remarkably similar to how the Tier list worked in July.
The Tier Data
As mentioned, August's data is a little weird. The unique decks was quite high at 80. Which is very high compared to July's 60 but not quite up to June's level of 87. I'm not sure why that happened. June made sense, it was the month MH2 was released and everyone was brewing. August didn't have the impetuous. My guess, based on what I saw, is that August was a tuning month. There were lots of singleton decks that were riffs on existing decks or mashups of several. Players were experimenting and looking for edges in August and at least a few found them.
 But unlike June, August's total decks were more like earlier months. May, June, and July had relatively low total populations of 488, 457, and 405 respectively. August's numbers are back in line with April's at 515 decks. Which is on the lower end of where Modern was last year. I'm not sure what's going on, but there were more events in August than July but not that many more. I didn't even include non-Wizards results this time since I didn't see any that met my inclusion standards.
You might expect that the much higher population and high deck count means that the tiered decks would challenge June's 28 deck record. That didn't happen. There are only 18 deck in August's tier list. Which is still up from July and on the lower end of the overall average, but it is unexpected. The cause is all the aforementioned singletons. They're unique and so get a separate entry but don't impact the tiers at all.
| Deck Name | Total # | Total % |
|---|---|---|
| Tier 1 | ||
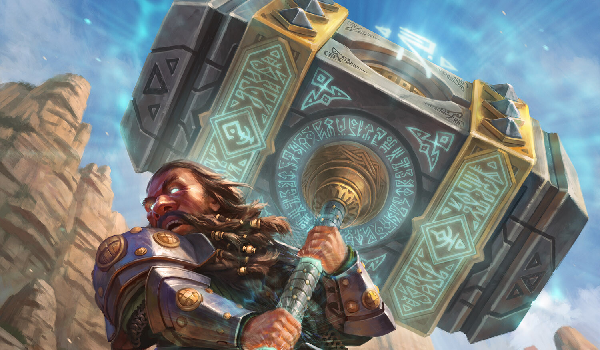
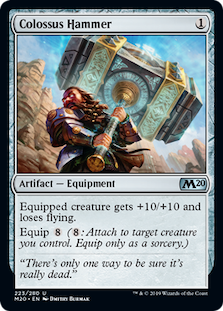
| Hammer Time | 53 | 10.29 |
| UR Thresh | 46 | 8.93 |
| Cascade Crashers | 37 | 7.18 |
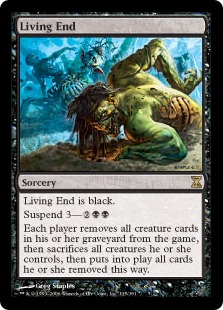
| Blue Living End | 31 | 6.02 |
| Tier 2 | ||
| Burn | 29 | 5.63 |
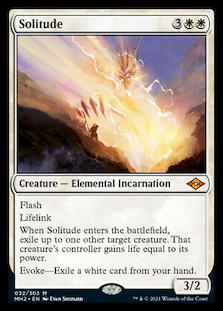
| Elementals | 28 | 5.44 |
| Grixis Channeler | 25 | 4.85 |
| Mono-Green Tron | 22 | 4.27 |
| Tier 3 | ||
| 4-Color Creativity | 18 | 3.50 |
| Jund Saga | 18 | 3.50 |
| UW Control | 16 | 3.11 |
| 4-Color Bring to Light | 13 | 2.52 |
| Mardu Rock | 10 | 1.94 |
| Jund | 9 | 1.75 |
| Eldrazi Tron | 8 | 1.55 |
| Hardened Scales | 8 | 1.55 |
| Mill | 7 | 1.36 |
| Yawgmoth | 7 | 1.36 |
The first and most important thing to note is that the upper Tiers are quite full relative to previous numbers. July only had four decks above Tier 3 and August doubled it, again moving back towards the average from the past year. The other thing that's striking is how many decks are right on the borderline between tiers. This indicates that the metagame is far closer than in previous months and the overall power in Modern is starting to get spread around. Whether or not that will be sustained is impossible to say.
Hammer Time is the most popular deck by a good margin, followed by UR Thresh. I expected both decks to fall off compared to July and they have. In absolute terms, Hammer Time is down 5 decks while Thresh is down 10. However, they didn't move from their metagame positions. To me, this says that the metagame is stabilizing and while the top decks aren't losing position, they are losing ground to the alternatives. Speak of which, July's Tier 2 is now part of Tier 1 and a lot of unexpected decks now comprise Tier 2. And there's a story here.
Rapid Rise and Precipitous Fall
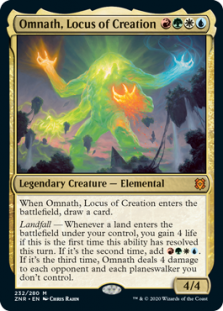 Tier 2's composition is the result of the weirdness of August's metagame shift. At the end of July, Elementals was having a huge resurgence. It had just won a Challenge and had become the It Deck, getting results everywhere and surging from obscurity to upper Tier 3. This continued into August and for the first few weeks it looked like Elementals would just dominate the postings. Then it just stopped. By mid-August Elementals just stopped putting up results. It seemed inexplicable initially, but then I heard that two other (re)surging decks, Burn and Tron, had good Elementals matchups. Both decks had been low Tier 3 at best this year but were suddenly right in the hunt. If they were preying on Elementals, then it fits that they'd fall off when Elementals did, and that was the case for Tron. Both decks had strong upward trends that just flatlined mid-August.
Burn meanwhile, had a slower start than Tron but kept picking up results all month. For the most part it's been Burn Classic as was played in 2017 (maindeck anyway). However, an alternative Burn deck using Dragons' Rage Channeler, Mishra's Bauble, and Lurrus of the Dream-Den has been getting results too. Not more than Classic, but enough to be noticeable. I don't think this new version is overall better than Classic since it's not running Eidolon of the Great Revel, but it's too new to tell. And another reason to watch Lurrus/Bauble for future bans.
Power Rankings
Tracking the metagame in terms of population is standard practice. However, how do results actually factor in? Better decks should also have better results. In an effort to measure this, I use a power ranking system in addition to the prevalence list. By doing so I measure the 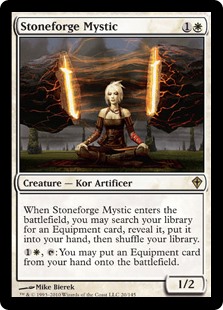 relative strengths of each deck within the metagame. The population method gives a decks that consistently just squeaks into Top 32 the same weight as one that Top 8’s. Using a power ranking rewards good results and moves the winningest decks to the top of the pile and better reflects its metagame potential.
Points are awarded based on the population of the event. Preliminaries award points for record (1 for 3 wins, 2 for 4 wins) and Challenges are scored 3 points for Top 8, 2 for Top 16, 1 for Top 32. If I can find them, non-Wizards events will be awarded points the same as Challenges or Preliminaries are depending on what the event in question reports/behaves like. Super Qualifiers and similar higher-level events get an extra point if they’re over 200 players, and a fifth for over 400 players. There was one Super Qualifier and a Showcase Qualifier awarding 4 points in July and no events that awarded 5 points.
The Power Tiers
Just like with population, the total points were up a lot in August. This tracks given the population, but might be surprising since there were fewer big events. Part of this was due to huge Preliminaries, but also all the events that I expected to be reported actually were. Thus August is up to 888 total points from July's 741. Once again, that's back in the typical range but still on the lower end compared to January and earlier. I could have hand-waved in some borderline events from MTGMelee and been right about average, but I decided against it. I'd rather have confidence in my sources than nice looking data. The events were just slightly too small to use, and I didn't see usable events anywhere else either.
The average points were 11.10, which would normally mean that 12 points makes Tier 3. However, 11.1 is so much closer to 11 than 12 that using the normal method feels rather dishonest. Therefore I decided this month I'm making an exception and the power Tiers start at 11. By chance, this decision didn't matter as no deck had 11 or 12 points. It was all 13 and above or 9 and below. I did a lot of agonizing for nothing. Anyway, the STDev was 19.08, which is fairly average again and again since it's so close to 19 rather than 20 round down. Thus add 19 and Tier 3 runs to 30 points. Tier 2 starts with 31 points and runs to 50. Tier 1 requires at least 51 points.
| Deck Name | Total # | Total % |
|---|---|---|
| Tier 1 | ||
| Hammer Time | 90 | 10.14 |
| UR Thresh | 89 | 10.02 |
| Cascade Crashers | 79 | 8.90 |
| Blue Living End | 57 | 6.42 |
| Elementals | 53 | 5.97 |
| Tier 2 | ||
| Burn | 47 | 5.29 |
| Mono-Green Tron | 37 | 4.17 |
| Grixis Channeler | 35 | 3.94 |
| 4-Color Creativity | 31 | 3.49 |
| UW Control | 31 | 3.49 |
| Tier 3 | ||
| Jund Saga | 27 | 3.04 |
| 4-Color Bring to Light | 21 | 2.36 |
| Mardu Rock | 19 | 2.14 |
| Yawgmoth | 17 | 1.91 |
| Eldrazi Tron | 14 | 1.58 |
| Hardened Scales | 14 | 1.58 |
| Mill | 14 | 1.58 |
| Jund | 13 | 1.46 |
I'd just like to note that a rarity occurred. Every deck on August's Population list made the Power Tier. Usually, there are a few from one that don't make the other and it isn't an equal exchange. Some months more decks make it on population than power, other's the other way around. To have the exact same decks though in very different orders for both is atypical. And again points to stability in the metagame.
Surprise Arrivals
Despite falling off as the month went on, Elementals did well enough initially to still make the cut to Tier 1. Which really makes me wonder if the bad matchups were really bad enough to warrant the apparent abandonment of the deck. 4-Color Creativity and UW Control just 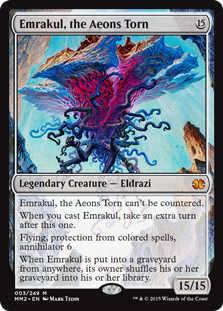 squeaked over the line to Tier 2. Creativity has distinguished itself from predecessor Lorehold Turns by keeping the strategy of Indomitable Creativity into big creature but ditched the turns package to just win with Emrakul, the Aeons Torn and sometimes Iona, Shield of Emeria or other big finisher. Which seems like a huge upgrade to me.
UW is somewhat surprising. When Wafo-Tapa (Wato0 on MTGO) won with UW playing maindeck Chalice of the Void, I thought that the old saw that only Wafo-Tapa can win with Wafo-Tapa decks would repeat. That clearly isn't happening and it's quite a contender. I'll be watching closely to see if this is sustained, especially with a new metagame incoming. I should also note that Grixis Channeler was my pick to make Tier 1 this month given how the previous few had gone. I was completely wrong and the deck ended up underperforming compared to my expectations.
Average Power Rankings
Finally, we come to the average power rankings. These are found by taking total points earned and dividing it by total decks, which measures points per deck. I use this to measure strength vs. popularity. Measuring deck strength is hard. There is no Wins-Above-Replacement metric for Magic, and I'm not certain that one could be credibly devised. The game is too complex and power is very contextual. Using the power rankings certainly helps, and serves to show how justified a deck’s popularity is. However, more popular decks will still necessarily earn a lot of points. Which tracks, but also means that the top tier doesn't move much between population and power, and obscures whether they really earned their position.
This is where the averaging comes in. Decks that earn a lot of points because they get a lot of results will do worse than decks that win more events, indicating which deck actually performs better. A higher average indicates lots of high finishes, where low averages result from mediocre performances and high population. Lower-tier decks typically do very well here, likely due to their pilots being enthusiasts. So be careful about reading too much into the results.
The Real Story
When considering the average points, the key is to look at how far-off a deck is from the baseline stat (the overall average of points/population). The closer a deck’s performance to the baseline, the more likely it is to be performing close to its “true” potential. A deck that is exactly average would therefore perform exactly as well as expected. The further away the greater the deviation from average, the more a deck under- or over-performs. On the low end, the deck’s placing was mainly due to population rather than power, which suggests it’s overrated. A high-scoring deck is the opposite.
| Deck Name | Average Points | Power Tier |
|---|---|---|
| Yawgmoth | 2.43 | 3 |
| Cascade Crashers | 2.14 | 1 |
| Mill | 2.00 | 3 |
| UW Control | 1.94 | 2 |
| UR Thresh | 1.93 | 1 |
| Mardu Rock | 1.90 | 3 |
| Elementals | 1.89 | 1 |
| Blue Living End | 1.84 | 1 |
| Eldrazi Tron | 1.75 | 3 |
| Hardened Scales | 1.75 | 3 |
| Hammer Time | 1.70 | 1 |
| Mono-Green Tron | 1.68 | 2 |
| Burn | 1.62 | 2 |
| 4-Color Creativity | 1.62 | 2 |
| 4-Color Bring to Light | 1.62 | 3 |
| Baseline | 1.56 | |
| Jund Saga | 1.50 | 3 |
| Jund | 1.44 | 3 |
| Grixis Channeler | 1.40 | 2 |
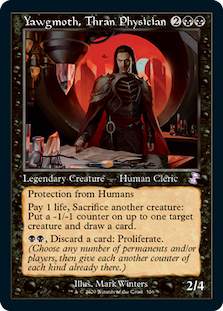 BG Yawgmoth beatdown/combo was the best average deck. This is probably because of it just barely making the population Tier 3. A lot of good results not getting spread around much does that. However, I think Cascade Crashers must be declared August's Best Deck. It outperformed not only the baseline but other Tier 1 decks by quite a bit. The winner of both the Population and Power standings, Hammer Time, is pretty average here, though the baseline is really low thanks to all the singletons that only earned 1 point. And Grixis Channeler still managed to fall way under the baseline. A clear underperformer.
And That's the Way it Was
And with that I'm closing the door on this metagame. Midnight Hunt and the soon-following Crimson Vow promise months of turbulence that will shake the relative stability that Modern had achieved in August. Or maybe they won't, we have to wait and see. But given that Consider is certain to be played in Modern, my money is on more metagame churn in the coming months.
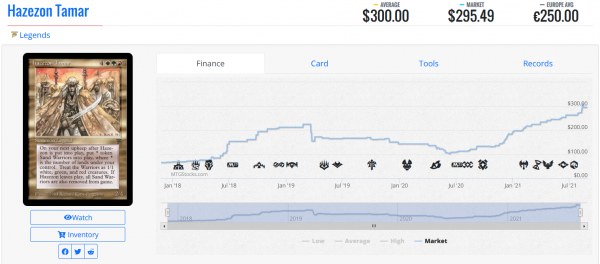


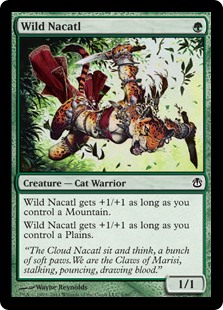 Consider Wild Nacatl. It was
  Consider Jace, the Mind Sculptor. When he was
  Which finally brings me this article's inspiration. Last week,
  In short, Looting was banned on its own merits. As Wizards stated, Looting was living on borrowed time even before Hogaak came along. Try to think back to the end of 2018 and through to Spring 2019. Or better yet, go back and
  Phoenix decks.
 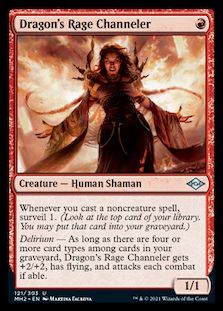 Consider a typical
 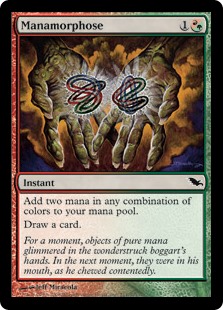 Start with turn 1 DRC into four Mishra's Baubles. Then on turn 2 let's chain all the Manamorphose into four Gut Shot and finish on two Lootings. That is 14 surveil triggers and 12 cards drawn. That is an opening hand, draw step, and 26 chances to see Phoenix's, for a hypergeometric probability of seeing one Phoenix of 97%, and the probability of seeing all four is now 9.5%. In this most extreme case, the opponent has taken four damage from Shots, and will be attacked for 15 leaving them at 1.
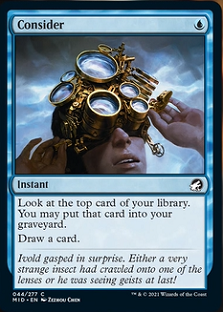 And here's a bigger problem.
 hard if not impossible. Everything depends more on how the question is asked and what criteria that question is evaluated with. It's especially unfair since all jokes aside, we're not clairvoyant. There's no way to know how things will actually turn out without practical experience. So there's no objective criteria for success in these things.
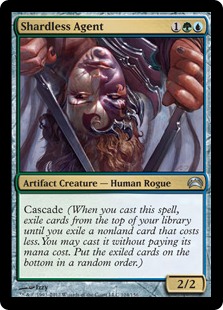 What Went Wrong
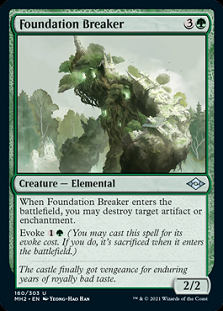 And on that front I have good news. According to MTGGoldfish, the only commonly played MH2 card that we didn't talk about at all is Foundation Breaker. It turns out that Living End really likes having an evoke Naturalize to fight through hate cards. And I think we missed it thanks to fatigue. Every time there've been cycling creatures or sacrifice effect creatures we've said something to the effect of "it may find a home in Living End." And we're often right. However, having done this for so many years, it just slipped our minds. We'd said it so often that it started losing meaning to us and we overlooked a key card in a popular deck.
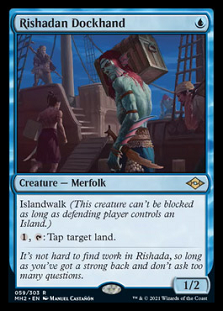 gushed too early. Tide Shaper was spoiled after I wrote that article and did what Merfolk needed much better. There was no way I could have seen that coming and nothing that made me expect that Dockhand would be superseded. And I did walk my assessment back a
 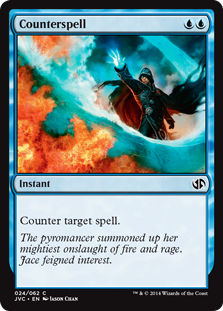 I feel as though our greatest strength this spoiler season was card evaluation. We were very good at assessing where cards fit into Modern. We didn't always get their contextual power right nor do we know if the deck will succeed, but we succeeded at evaluating a card's role.

 When I bet on Modern, I'm betting on it being most popular format on MTGO. And only on MTGO. The simple fact is that it's the only way to measure Modern's popularity relative to other formats. Arena only has Standard and Historic and so can't answer wider question of most popular format when given a choice. Also, Arena's playerbase will be quite different from MTGO's thanks to Arena being free-to-play. (And yet somehow more expensive to build decks on.) It's critical to compare like-to-like and by excluding Arena, I don't risk comparing very different population compositions. Saying that Standard is the most popular because it's the main option on the most played digital Magic produc, since it's one of two options and cheaper than Historic, really isn't fair to Standard or other formats.
 I'm also not going to compare the constructed formats to limited. It really isn't a fair comparison. In my experience, most competitive players will say their favorite format is booster draft, with a caveat. In said experience, players tend to extoll booster draft the concept as the most skill-intensive format and also most fun. Winning requires format knowledge, deck building skill, play skill, and luck more than other formats because you're building your deck as you go. However, the more this general opinion is investigated, the more exceptions, exclusions, and complications arise. Certain sets are more popular to draft than others. Draft participation also swings wildly from introduction to rotation. Thus, the exact timing of a study will wildly affect the data on limited, and it makes sense to cut it.
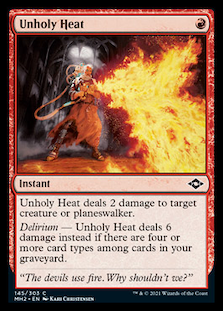 This study is limited to data from MTGO. Sadly, there aren't enough paper results to draw any real conclusions. The few events that are out there don't really compare well to each other and they're not distributed evenly. Pre-pandemic, this whole project would have been easy since there were plenty of events of all levels in all formats. Plus, these events usually published their attendance numbers so comparing that would have fairly definitively answered the question. That isn't possible now.
 The various social media pages that kept track of weekly events have not been updated, and a number of stores went bust while others opened during the pandemic. Finding all the stores doing in-person events and asking them about attendance is far more work than I'm able and willing to do on my own. (With the right funding, on the other hand....)
 With Vintage, it was purely a judgement call. Vintage has accessibility issues which keep newer players out. The cost of Vintage cards is so high that it really can't be played in paper. Thus, Vintage players have mostly moved online. However, the lack of overlap between Vintage decks other formats means that it's hard to transition to Vintage naturally. There's more overlap between Standard and Modern cards than Legacy and Vintage, for example. It's an enthusiast's format, and I was told by several sources that the community is quite static. While it'd be a reasonable comparison point for the other, more variable formats to compare to the old-timer, I decided that the extra effort wasn't worthwhile just to learn that Vintage is a fairly insular and stable group compared to other formats.
 I am going to measure the relative popularity of the tournament-supported constructed formats on MTGO. These are Pioneer, Modern, Pauper, and Legacy. To accomplish this, I gathered three sources of data. The first is from each formats Tournament Practice room. Over last Sunday afternoon, I watched each room for 10 minutes apiece, recording each time a match fired. This source indicates the relative number of players in each format by measuring how quickly a match could be found. More matches means more players means more popular.
 Preliminaries fired each week. The sample included each complete week in July and the first week of August. I'll then compare the average Preliminaries per week to the theoretical max to indicate the most popular Preliminary format.
 The answer is Modern. By quite a large margin. And I'm fairly certain that I missed a few Modern matches as at several points there were multiple players creating and then closing matches to join someone else's. So it should be a higher blowout. The Pioneer room was practically dead, saved because there was some kind of non-Wizards tournament happening and the players were starting their matches. Pauper and Legacy were quite comparable, which was surprising. I'd been told Pauper was in a very bad place and wasn't seeing play, but that seems to have been inaccurate.
 That's another point in Modern's column. It not only had the highest average in absolute terms with 4.8, but the highest percentage. Both Modern and Pioneer had 8 Preliminaries scheduled, so 4.8/8=60% of Modern Preliminaries fired versus 1.8/8=22.5% for Pioneer. Legacy records 2.8/6=46.7% for a strong second place.
 Modern has the largest Challenges, followed by Legacy. Pauper has the least, with 150 points separating it from Modern. It's clearly not a highly played format right now. Though I'd actually argue Pauper is actually the best value for entry. It only took 6 points to make Top 32 of several of these events, which is two match wins. That's not a very big hill to climb to get prizes. I thought Legacy would be higher since the Legacy crowd tend to be vocal, but the stats don't lie, it's just above Pioneer and well below Modern.